")
New Card Visual Tutorial - Power BI (June 2023 Update)
Technical Lead - Business Intelligence • Microsoft Certified PL-300 • Data Analyst • Power BI Youtube
This is how to use the New Card Visual in Power BI (June 2023 Update)
The June 2023 release of Power BI Desktop introduces a new visual called the card visual. This visual is designed to enhance the way users interact with data using cards and offers improved functionality and performance. The card visual allows users to display multiple cards in a single container and provides full control over each component of the card.
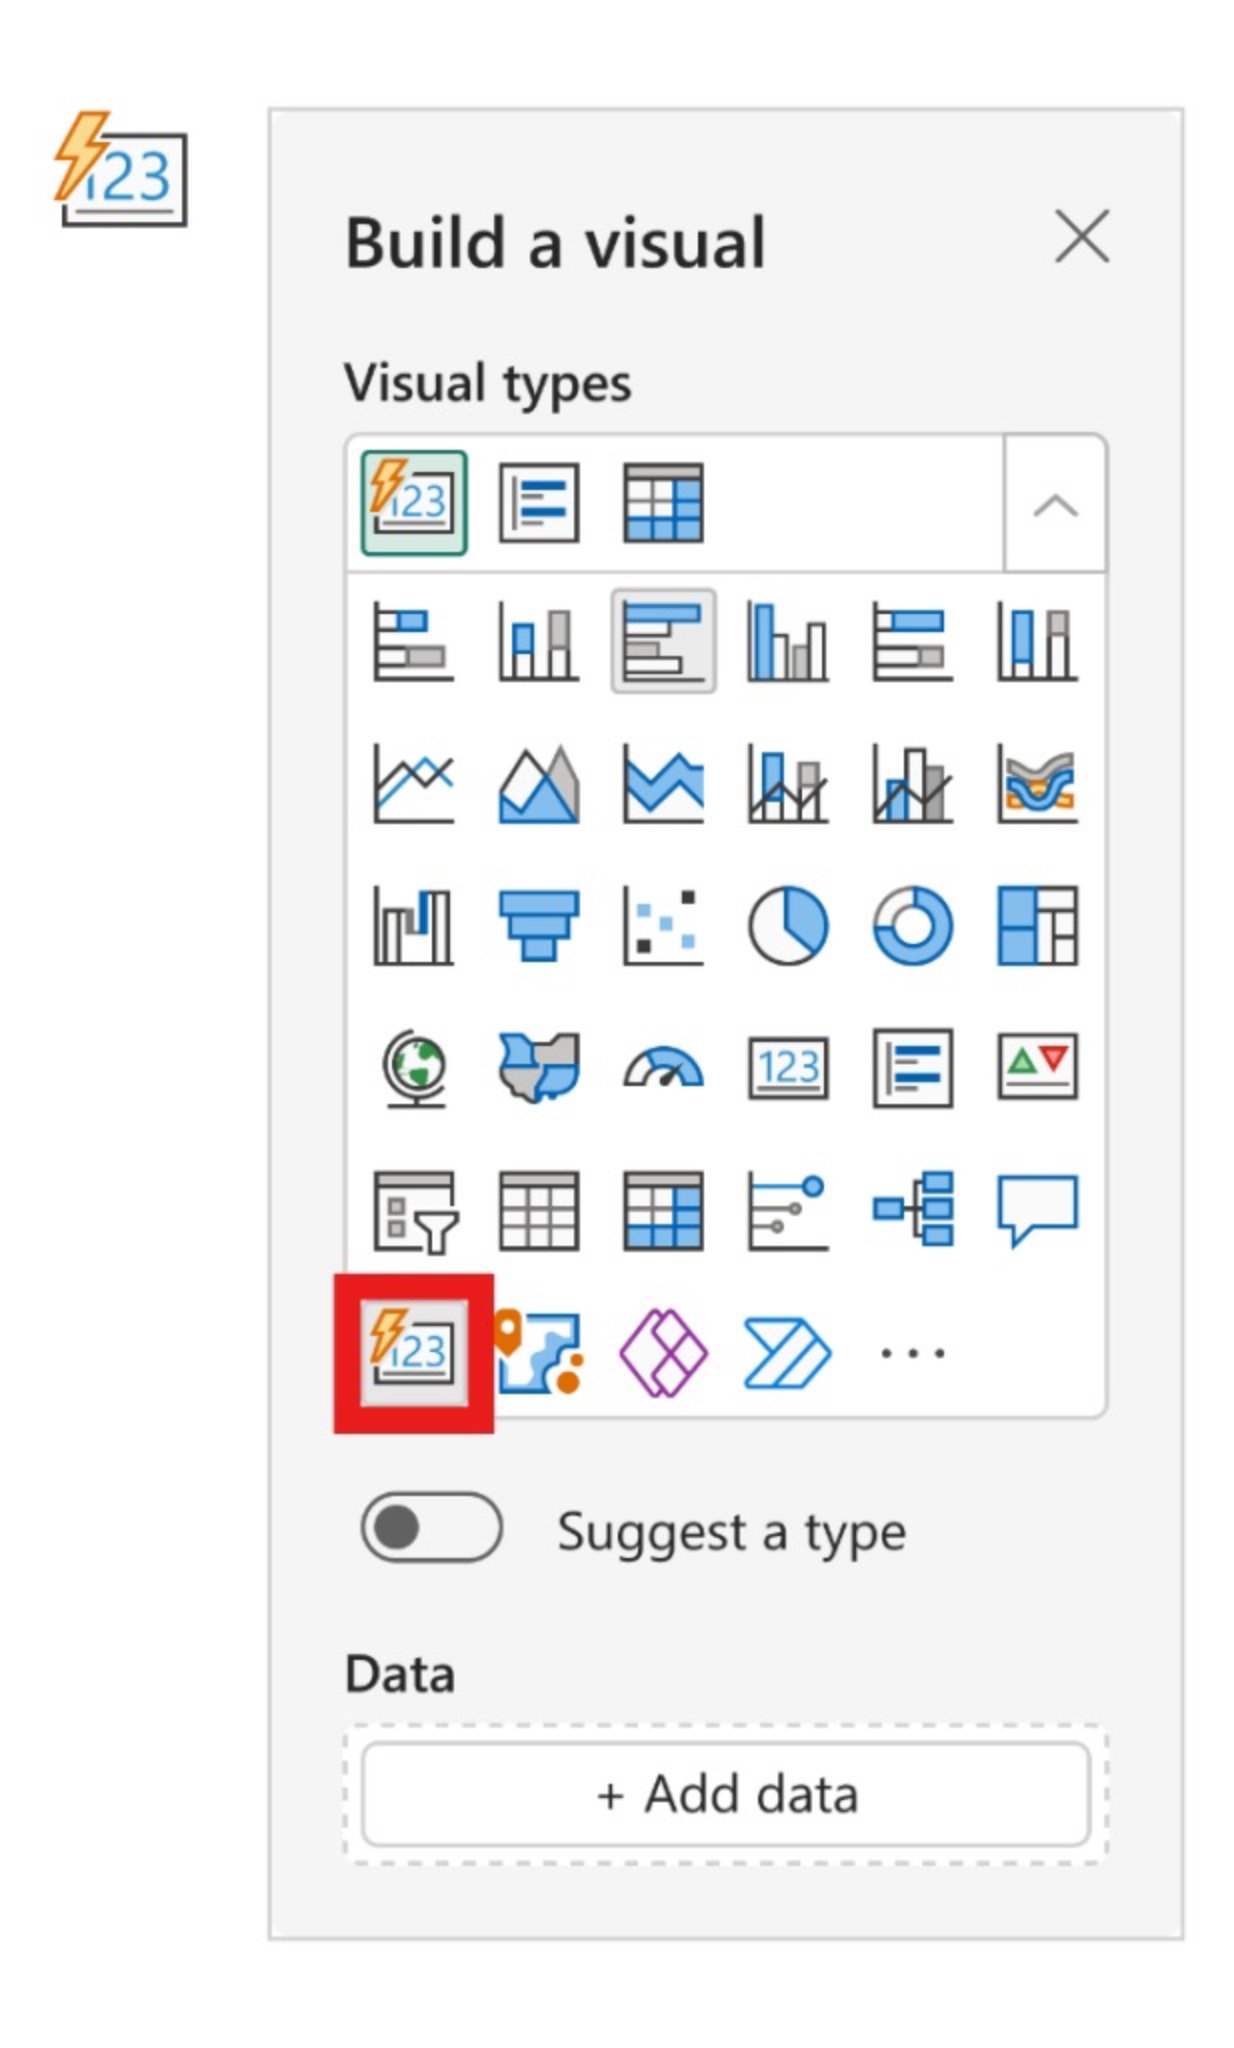
To access the new card visual, users can find it in the visual gallery either in the ribbon or the on-object dialog. The preview feature for the card visual is enabled by default, but users have the option to disable it if they prefer. Building a new card visual can be done by inserting a new visual from the ribbon, right-clicking on the canvas and selecting "add visual," or dragging fields from the data pane and selecting the new card from the on-object dialog.
- New card visual for PowerBI desktop
- Displays multiple cards in a single container
- Full control over each card's components
- Supports multiple fields and refined formatting settings
- Improved functionality and performance
- Accessible through the visual gallery
- Preview feature enabled by default
- Option to disable preview feature
- Easy to build and customize
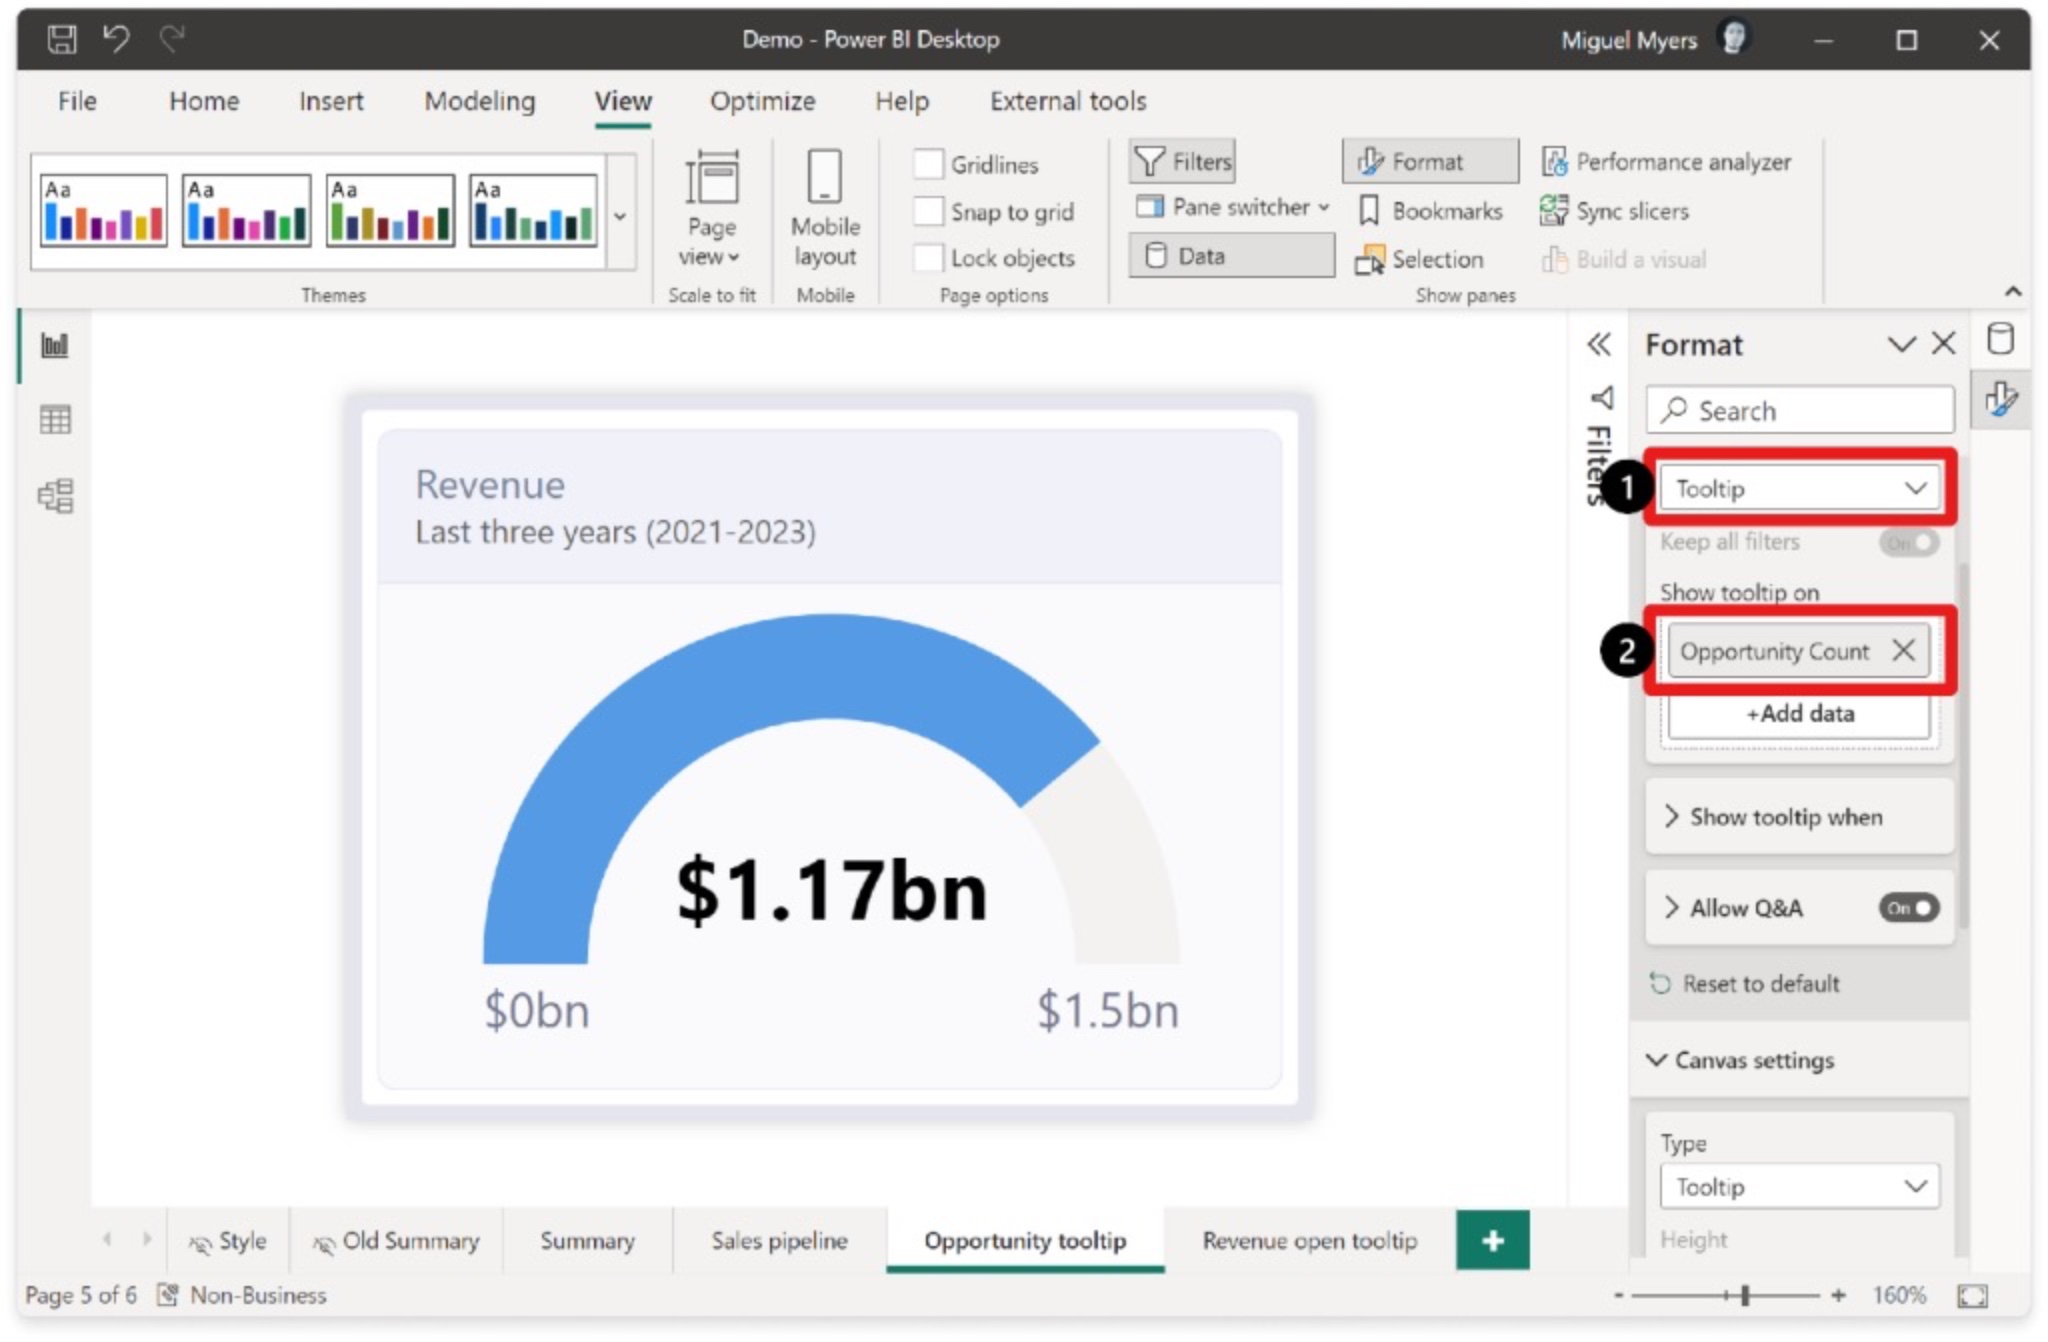
The new card visual supports interactivity features such as tooltips and drill-through. Users can assign report page tooltips to each card and update them by selecting the visual, going to the format pane, and choosing the appropriate settings. Drill-through
There are some limitations and known issues with the card visual during the preview period. One issue is that the shadow and glow effect can unexpectedly change the size of all cards. The development team is actively working on resolving this problem.
Overall, the new card visual in Power BI Desktop offers a visually appealing and highly customizable way to interact with data, improving report performance and accessibility for all users.
Enhanced User Interaction with New Card Visual
The new card visual in Power BI Desktop provides users with an enhanced experience when interacting with data. With the ability to display multiple cards in a single container, users can easily compare and analyze data points. The full control over each card's components allows for customization and a more effective visual representation of the data. This improvement in functionality and performance makes the new card visual a powerful addition to Power BI Desktop's capabilities.
Read the full article New card visual for PowerBI
Learn about New card visual for PowerBI
The June 2023 release of PowerBI Desktop introduces a new visual called the card visual which allows users to display multiple cards in a single container with full control over each card's components. It supports multiple fields and offers refined formatting settings. To access the new card visual, users can find it in the visual gallery either in the ribbon or the on-object dialog. The preview feature for the card visual is enabled by default, but users have the option to disable it if they prefer. Building a new card visual can be done by inserting a new visual from the ribbon, right-clicking on the canvas and selecting "add visual," or dragging fields from the data pane and selecting the card visual. The card visual offers improved functionality and performance compared to previous visuals, allowing users to better interact with their data.
More links on about New card visual for PowerBI
- Power BI Card Visualizations - Two Ways for Creating Card
- Power BI Card Visualization- What is Card in Power BI, Create Power BI Card using report editor, ... New dashboard: Type the name of a dashboard(New).
- Power BI Card - How to Use + Examples
- Sep 16, 2021 — We can use the Power BI card visual for both Power BI Desktop and Power BI Service. It is useful to show a single numerical value or a metric ...
- Push Card visuals to a new level in Power BI | by Nikola Ilic
- Push Card visuals to a new level in Power BI · Step 1 — Insert images and create bookmarks · Step 2 — Setting visibility within bookmarks · Step 3 — Playing around ...
Keywords
Power BI Card Visual, Power BI Desktop Visual, Power BI June 2023 Release, Power BI Multiple Fields, Power BI Refined Formatting Settings, Power BI Preview Feature