
Master Data Forecast Visualization in Power BI
Software Development Redmond, Washington
Discover Power BIs Enhanced Forecasting Tools for Effective Data Predictions!
Microsoft announced new forecasting abilities for Power View in Office 365 at the PASS Business Analytics conference. Power View now includes predictive forecasting and hindcasting for data visualization and exploration. With built-in models, it automatically detects data seasonality to provide accurate forecasts.
For optimal forecasting, time series data or consistent whole numbers are required, and only single-line charts are effective. Adjusting confidence intervals or outlier data can influence the forecast outcomes, and hindcasting helps predict past data based on older information.
Users can assess prediction quality by altering confidence intervals or practicing hindcast techniques on historical data. The forecasting tool performs complex statistical analysis to integrate trends and seasonal patterns, offering customizable options for tailored results.
The Power View forecasting feature is accessible for users to experiment with their data or through a sample report. Users simply upload a Power View time series line chart to Power BI for Office 365, switch to HTML 5 version, and apply forecasting options available in the Analysis pane.
By dragging the forecast handle, hindcasting can illustrate how past values would have been projected. A hindcast is essentially a new forecast that considers different seasonal factors, and it can be undone by clicking an arrow next to the forecast dot.
A line chart is required for accurate hindcasting, it needs enough seasonal period data, and filtering your data can impact results. Hindcast effectively creates a unique forecast with its own seasonality detected by Power View.
To adjust forecasts, users can manually set data seasonality and require a sufficient number of data points for accuracy. Similarly, standard deviations can be modified to display the forecast's confidence interval, providing visual reliability indications.
Exploring what-if scenarios and adjusting for outliers is possible by manipulating data points within the chart, which influences the resulting forecast. These changes only affect the visual representation and not the source data. However, note that the what-if analysis feature only works in the HTML5 version of Power View.
There are essential criteria for forecasting in Power View: Only line charts are eligible, x-axis values must be dates or increasing whole numbers, and charts must contain fewer than 1,000 values. Missing values are completed by Power View before forecasting, and there are limitations if more than 50% of data is missing or inferred.
Users should be aware that while filtering data can refine the forecast, it might also diminish its quality or overextend Power View's data completion threshold. Additionally, while the HTML5 Power View sheets can be printed, the forecast and analysis won't appear on the printout. For any undo actions, users must refer to the Remove predictions feature instead of Ctrl-Z.
Power BI's Evolving Forecasting Features
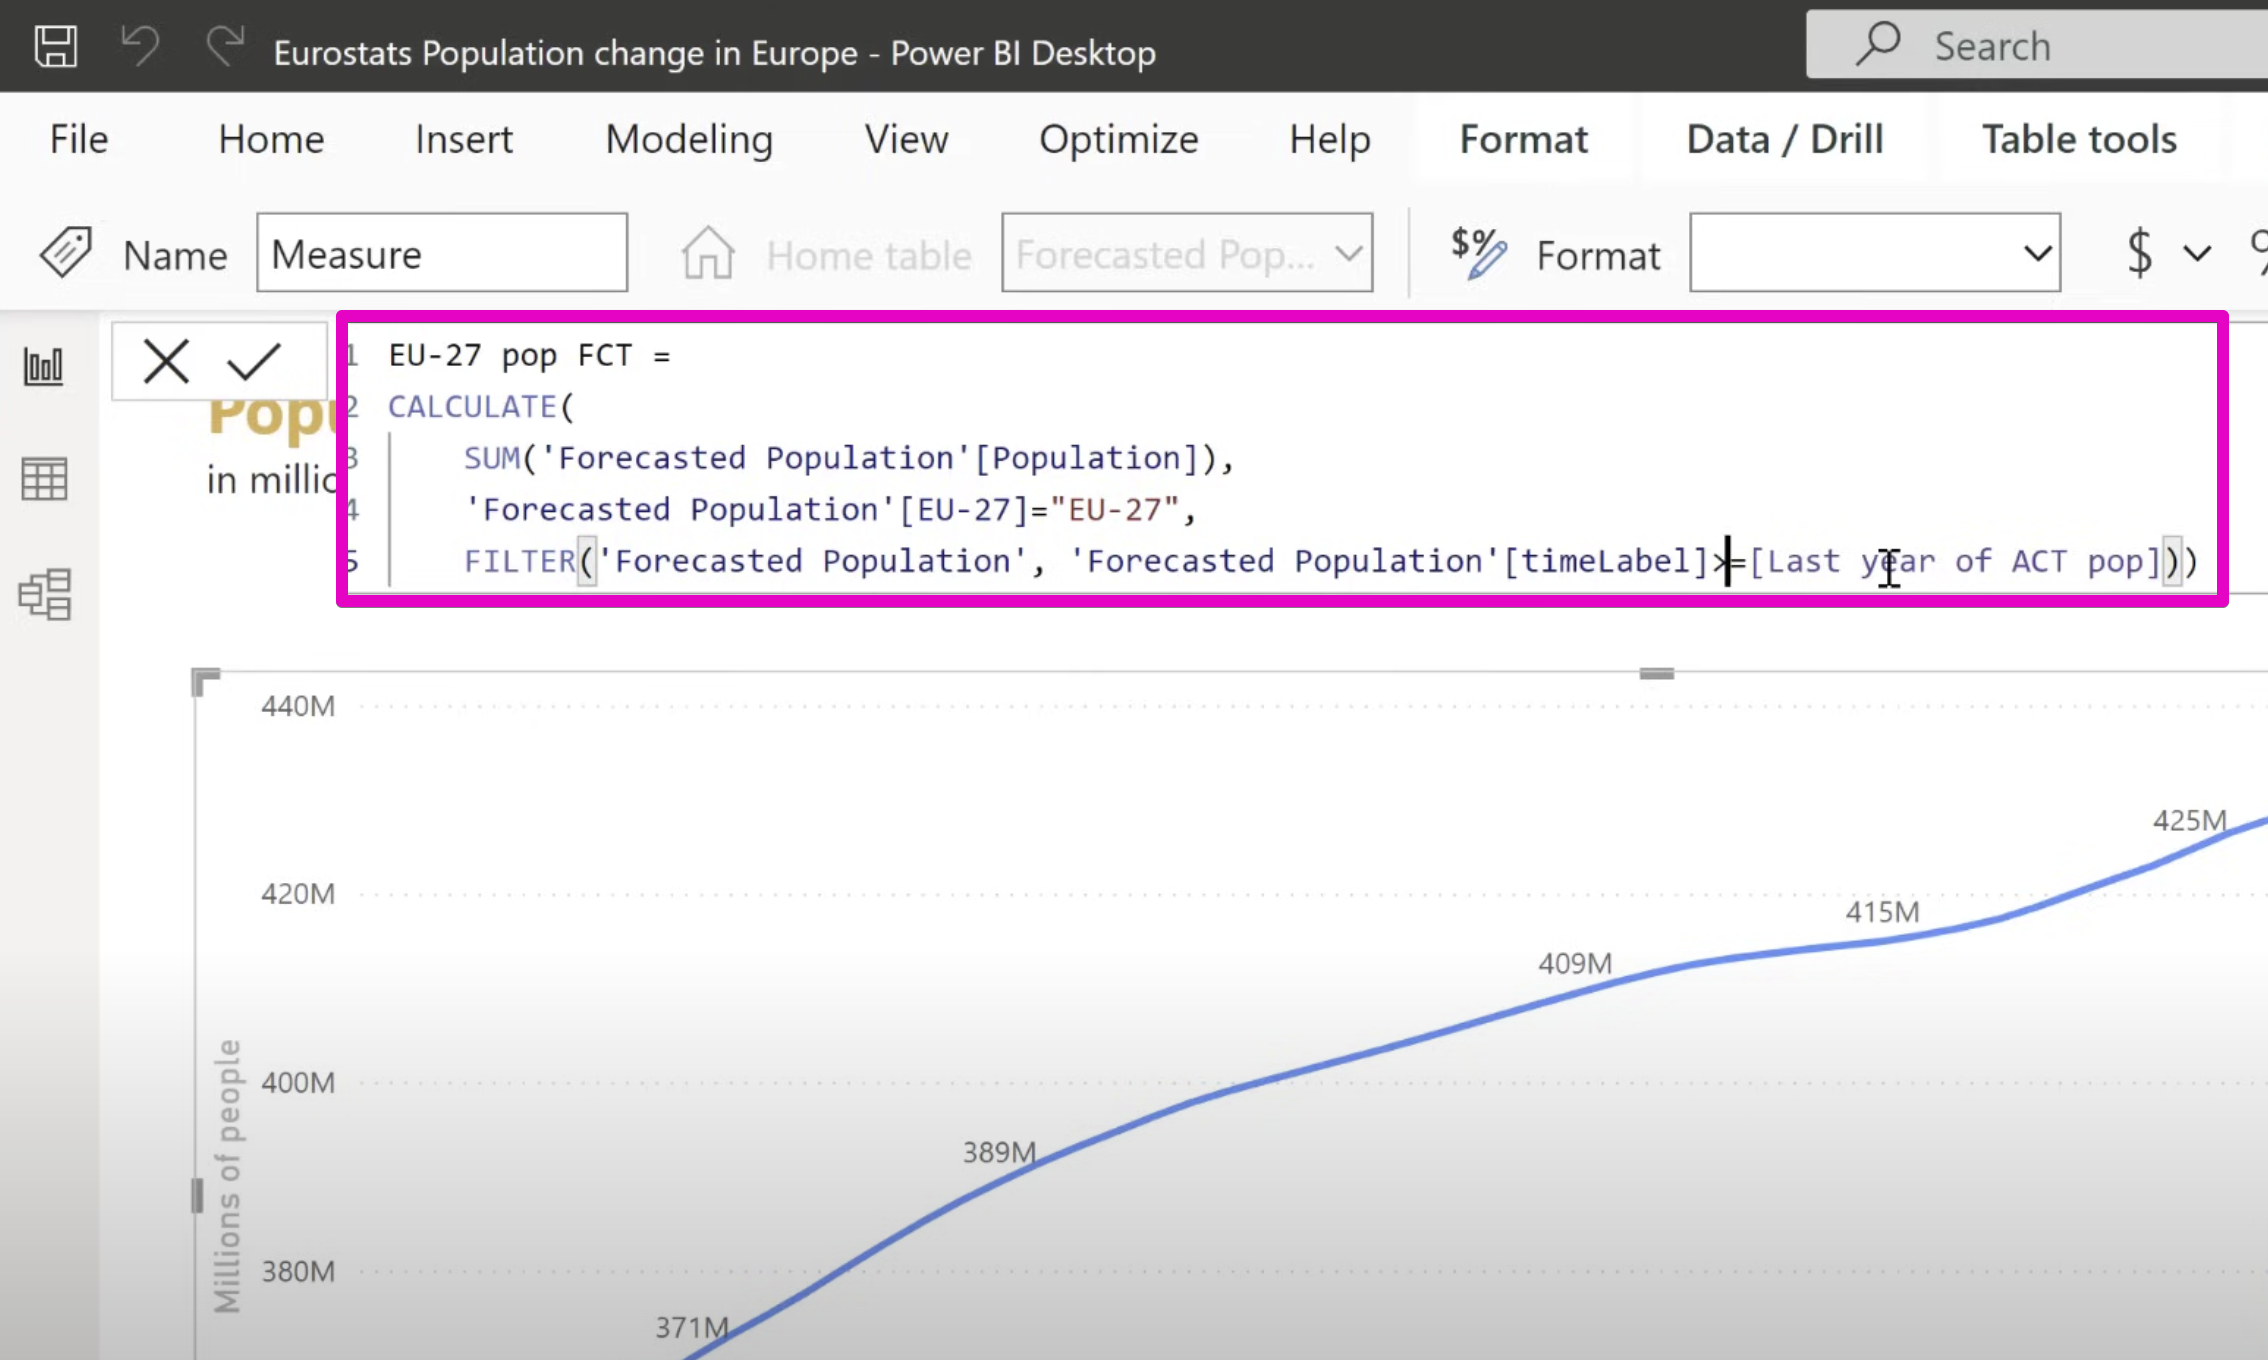
Power BI's newest enhancements aim to transform data forecasting by integrating more intuitive and predictive models. With its advanced analytics, users can now delve into data visualization with an added layer of forecasting that can predict future trends and offer historical data insights. The introduction of this capability allows businesses and individuals to efficiently analyze and predict outcomes, making strategic decisions based on a more comprehensive data set. With Power BI's continual updates, this feature is indicative of how data analysis tools are advancing, becoming more user-friendly and robust in their functionalities.

Step-by-Step Guide on Forecasted Data Visualization in Power BI
Introducing new forecasting capabilities in Power View for Office 365, the Power BI team at Microsoft announced this feature during the PASS Business Analytics conference. With these enhancements, Power View now supports both predictive forecasting and hindcasting. Users can utilize built-in predictive forecasting models which employ exponential smoothing, automatically detecting seasonality in the data for generating forecasts.
This forecasting tool allows users to explore forecast results by adjusting confidence intervals or by altering outlier data to observe various outcomes. Furthermore, hindcasting is available, enabling users to see how past predictions would have played out based on historical data. Data best suited for forecasting includes time series data or consistently increasing whole numbers, with a requirement for single-line charts only.
Forecast users can assess prediction quality by modifying the confidence interval or by putting the tool to the test on historical data to evaluate its practical performance. The forecasting utilizes sophisticated statistical analysis incorporating trends and seasonal factors. For users to obtain optimal forecasts, it's recommended to familiarize themselves with these methods and consider the potential for customization.
Engage with Forecasting
Keen users can try the forecasting capabilities on their data or utilize available sample reports. By uploading a workbook containing a Power View time series line chart to Power BI for Office 365, users can then opt for the HTML 5 version of Power View. As users engage with the line charts, the forecast and analysis options appear, enabling them to visualize future trends.
Hindcasting provides a glance at how the forecast might have predicted recent occurrences had it been run in the past. By engaging with this feature, users can drag the forecast handle on the chart to historically project current values. This process is reversible, and any unwanted forecasting can be undone with a simple click.
Customizing Forecasts
Adjusting forecasts is user-friendly with Power View automatically detecting data's seasonality. Seasonality adjustments and confidence interval alterations help improve the forecast's accuracy. Users can manually input seasonality values to refine forecasts further or adjust standard deviations to visualize the reliability of predictions. These adjustments enhance the quality of forecasting.
Considering outliers and experimenting with what-if scenarios allow users to explore different forecasting outcomes. Adjustments on a line chart impact the forecast's trajectory, though these changes don't alter the underlying data in the workbook or data source. Remember that these features are only available in the HTML5 version of Power View with forecasting.
Limitations and Considerations
Forecasts are exclusively available for line charts meeting specific criteria, such as the x-axis having a date/time format or being a uniformly increasing whole number. Accuracy is contingent on the chart criteria being met, including the presence of one line and less than 1,000 values. Plus, Power View can supplement missing values before forecasting, with the capacity to fill in gaps up to half of the chart's values.
When filtering forecasts, users should understand that altering historical data may reduce the quality of the forecasting. Filters may trigger Power View to complete over 50% of the chart's values, in which case forecasting capabilities would become limited or inaccessible. Additionally, users are cautioned that while the HTML5 version of Power View can be printed, the forecasts and analyses are not included in the printout, and typical undo actions via Ctrl-Z are not supported.
Keywords
forecasted data visualization Power BI, Power BI forecasting tutorial, data visualization techniques Power BI, Power BI predictive analytics, creating forecasts in Power BI, Power BI step-by-step guide, business intelligence forecasting, Power BI visualization best practices, advanced Power BI forecasting, insight-driven visualization Power BI