
Launch of VISUAL SHAPE: Revolutionize Power BI Calculations
Master Visual Calculations in Power BI with the New VISUAL SHAPE Feature - Simplify Data Analysis!
Key insights
- Introduction of VISUAL SHAPE for hierarchical structure in Power BI visual calculations, simplifying the creation and understanding of complex calculations.
- Visual calculations implementation in Power BI involves understanding the new visual context, ROWS, COLUMNS, CALCULATE, and modifiers such as EXPAND and COLLAPSE.
- Transformation of flat tables to hierarchical structures using the VISUAL SHAPE clause allows Power BI to display data in matrices with subtotals and organized rows and columns.
- Usage of DEFINE COLUMNS in queries to create visual calculations and the process involving renaming columns, adding VISUAL SHAPE, and removing unnecessary data.
- Potential of VISUAL SHAPE in simplifying complex data navigation and calculations in Power BI, setting the stage for advanced functions like PREVIOUS and NEXT.
VISUAL SHAPE in Power BI
The introduction of the Visual Shape feature represents a significant advancement in the way Power BI handles visual calculations, offering users a more intuitive approach to analyzing hierarchical data. This feature not only simplifies the process by allowing the creation of complex calculations tied specifically to visuals but also improves data representation through the transformation of flat tables into structured, hierarchical matrices. By providing a clearer context and a logical structure, Visual Shape makes it easier for developers to navigate and manipulate data within Power BI.
Furthermore, the ability to define visual calculations through the DEFINE COLUMNS clause and the subsequent processing steps including renaming columns and applying the VISUAL SHAPE clause, demonstrates the deep level of customization and flexibility available in Power BI. This approach not only enhances the clarity of the data presented but also maximizes the efficiency of visual calculations.
Lastly, the metadata added by VISUAL SHAPE is crucial in enabling functions like PREVIOUS and NEXT, which rely on the hierarchical structure to function correctly. This makes it easier for users to perform complex navigational tasks within their data without needing to resort to more complicated SQL functions. Overall, the VISUAL SHAPE feature is a powerful tool in the Power BI arsenal, providing users with enhanced capabilities for data analysis and visualization.
Introducing VISUAL SHAPE for Visual Calculations in Power BI
The VISUAL SHAPE clause is introduced as a game-changer for visual calculations within Power BI. It defines a hierarchical structure for tables, enhancing the simplicity and accuracy of calculations tied to specific visuals. Initially available as a preview feature in the February 2024 Power BI release, visual calculations aim to streamline the creation of calculations tied to visuals, particularly beneficial for complex assessments.
Developers venturing into more intricate calculations need a firm grasp of various technical aspects. These include understanding the hierarchical structure of the virtual table, new visual contexts, and the functions and modifiers like EXPAND and COLLAPSE that play critical roles in visual calculation implementation. SQLBI's first article on this topic delves into VISUAL SHAPE and visual calculation basics, highlighting the provision of a detailed explanation in a forthcoming whitepaper for SQLBI+ subscribers.
Exploring the Execution of Visual Calculations
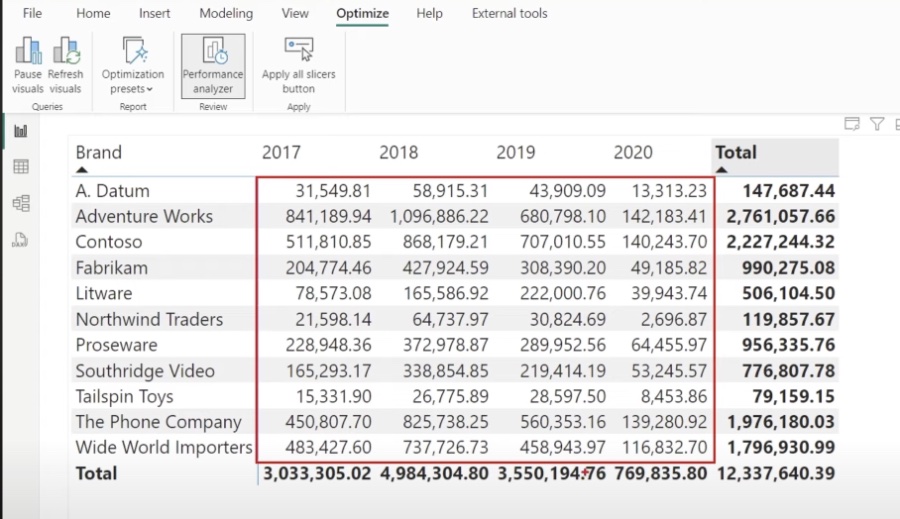
Visual calculations transform flat query results into dynamic, well-organized matrix visuals, like sales data sliced by brand and year. SQLBI explains how Power BI discerns subtotal rows within flat table outputs, highlighting the crucial role of the VISUAL SHAPE clause in adding hierarchical structure and enabling such interpretations. An intriguing example provided is a visual calculation of growth percentage between consecutive years, showcasing the practical application of VISUAL SHAPE and PREVIOUS function in achieving insightful visual representations.
Fundamentals of the VISUAL SHAPE Clause
The VISUAL SHAPE clause significantly impacts the base query processing, involving steps like column renaming and densification. It introduces a hierarchical structure to the data, organizing it by defined axes (ROWS and COLUMNS), which are crucial for visual calculations. SQLBI's example illustrates how more complex hierarchical structures, involving additional grouping and sorting levels, enhance the functionality and complexity of VISUAL SHAPE.
Key Takeaways on Visual Calculations
Visual calculations are predicated on the metadata introduced by VISUAL SHAPE, with each axis having defined levels that aid in the correct interpretation and computation of functions like PREVIOUS and NEXT. The VISUAL SHAPE not only simplifies data navigation but also underscores the importance of understanding its syntax and the broader context it creates for visual calculations. This foundational knowledge sets the stage for future explorations into the nuances of visual calculation, including the lattice of levels and navigation techniques like EXPAND and COLLAPSE.
SQLBI emphasizes that this is just the beginning of understanding visual calculations in Power BI. The intricacies of visual context, current level management, and densification process are topics slated for future articles. For those keen on delving deeper, the SQLBI+ platform promises a comprehensive Visual Calculation whitepaper by the end of March 2024, marking a significant resource for advanced learning in this domain.
## Questions and Answers about Microsoft 365
Keywords
Power BI Visual Shape, Visual Calculations Power BI, Visual Shape Feature, Power BI Enhancements, Power BI Visualization Tools, Advanced Visualizations Power BI, Power BI Visual Shape Calculations, Power BI Interface Improvement