
How to Group Visuals in Power BI Using DAX Measures
Master Power BI Visual Grouping with DAX - Learn ALL, ALLEXCEPT & More for Dynamic Reports!
Key insights
- Learn to use DAX functions in Power BI for grouping items in visuals.
- Key functions include ALL, ALLEXCEPT, ALLSELECTED, and REMOVEFILTERS.
- Formal training on Microsoft products including Power BI and Azure is available.
- On-Demand Learning offers a Free Community Plan to get started.
- Pragmatic Works provides a range of learning options including boot camps, hackathons, and virtual mentoring.
Deep Dive into Power BI and DAX Functions
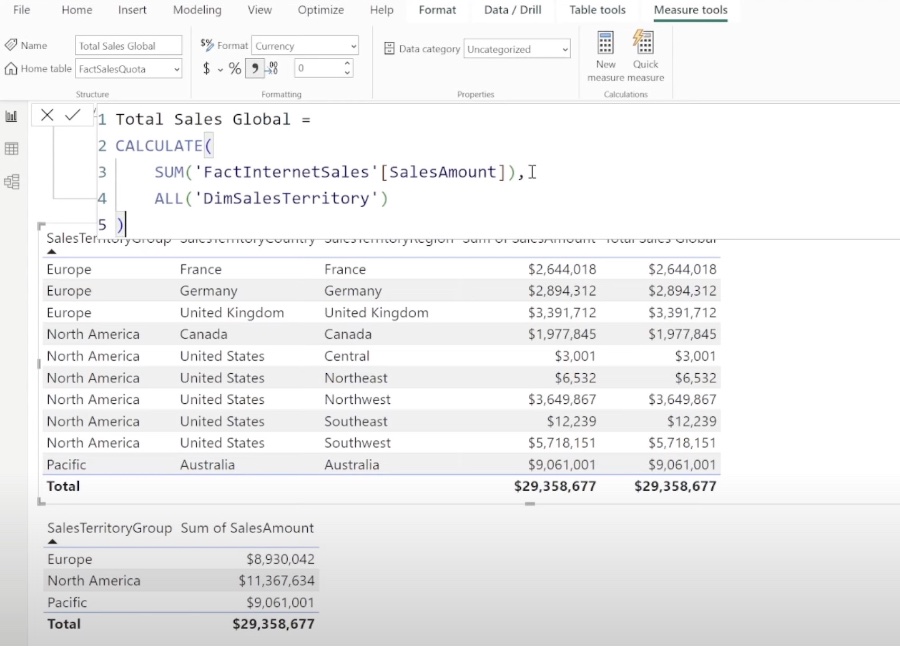
In this tutorial by Pragmatic Works titled "Grouping Items Together in Power BI Visuals Using DAX Measures," viewers get an introduction to utilizing DAX functions to enhance their visuals. The tutorial focuses on how to group various items in visuals using specific DAX measures including the ALL, ALLEXCEPT, ALLSELECTED, and REMOVEFILTERS functions. This is an essential skill for improving data analysis and visualization in Power BI.
This insightful video tutorial is not just about learning DAX measures but also opens up opportunities for those interested in gaining more in-depth knowledge about Microsoft products. Although Pragmatic Works offers a range of formal training on Microsoft Teams, Teams, Power Apps, Azure, and more, this particular guide stands out by providing practical, hands-on experience with data grouping in visuals.
Moreover, Pragmatic Works supplements the learning experience with various resources. They encourage learners to embark on their journey by starting with the FREE Community Plan. This commitment to educating their audience is further highlighted through their wide range of on-demand learning packages, boot camps, hackathons, virtual mentoring, and private training options. These resources are designed to cater to different learning styles and professional needs.
- DAX measures to group items in visuals
- Advanced training opportunities on Microsoft products
- Resources for continued learning and professional development
For those engaged in or aspiring to work with data analytics and visualization, understanding how to effectively use DAX measures for grouping items in visuals is crucial. Pragmatic Works, through its tutorial, provides a highly accessible yet profound guide that can help enhance one’s capability in creating more insightful and organized visual presentations. This skill is invaluable in making data-driven decisions and presenting complex data in an understandable way.
Power of DAX in Power BI
Dynamic Analysis Expressions (DAX) in Power BI are a set of functions, operators, and constants that can be used to perform advanced calculations and create new insights from data. Learning how to use DAX effectively can significantly enhance your data modeling capabilities and allow you to unlock deeper insights from your data.
DAX functions like ALL, ALLEXCEPT, ALLSELECTED, and REMOVEFILTERS, as discussed in the Pragmatic Works tutorial, are instrumental in manipulating data for varied analytical needs. Whether you're looking to aggregate, filter, or transform your data, understanding DAX functions opens up a world of possibilities for data analysis and visualization. This expertise is not only relevant for personal growth within the analytics field but also adds tremendous value to any organization by enhancing its data-driven decision-making processes.
People also ask
### Questions and Answers about Microsoft 365"How to group measures together Power BI?"
In Power BI, navigate to the report view and click on the field well space of the visual where grouping is intended. From the roster of available measures, select the ones you aim to group. By right-clicking on these chosen measures, you'll find and can select the “Group” option to effectively bundle them together.
"How do you group items together in Power BI?"
Utilizing the grouping functionality within Power BI offers another avenue for organizing items. This feature is easily accessible and I'll guide you through the specifics of how it works.
"Can you group by in DAX?"
Indeed, DAX offers the GROUPBY function which is designed to organize a chosen subset of rows into summary rows, based on the values in one or more specified columns. This function is adept at delivering a singular row for each identified group, making it an invaluable tool for running aggregations on the results derived from various DAX table expressions.
"How do you group visuals in Power BI?"
To orchestrate a group of visuals within Power BI Desktop, commence by selecting an initial visual from the canvas. While holding down the CTRL key, proceed to select additional visuals to be included. Through the Format menu, navigate to Group, and within the subsequent submenu, finalize the grouping. These assembled groups can be monitored and adjusted via the Selection pane.
Keywords
Power BI group items, DAX measures tutorial, visual grouping Power BI, DAX Power BI grouping, Power BI visualization techniques, group data Power BI DAX, optimizing Power BI visuals, DAX visual grouping strategies