Power BI Calendar Table: 3 Demo Methods
Founder | CEO @ RADACAD | Coach | Power BI Consultant | Author | Speaker | Regional Director | MVP
Master Power BI date tables to fix DAX time intelligence and fiscal errors with Mark as Date Table in Microsoft Fabric
Key insights
-
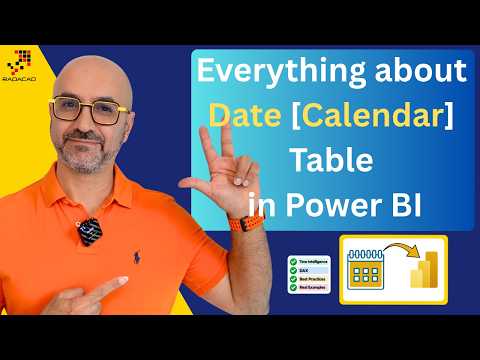
Power BI date table: This YouTube video explains why a dedicated date table is the foundation for accurate time-based metrics in Power BI.
It shows that missing or misconfigured date tables cause Year-to-Date, month comparisons, and fiscal calculations to return wrong or empty results. -
time intelligence: Functions like TOTALYTD, SAMEPERIODLASTYEAR, and DATEADD require a continuous, unique date column to work correctly.
The video demonstrates how these functions fail or give silent errors when the date table is absent or not marked correctly. -
Source / DAX / Power Query: The presenter contrasts the three practical methods to add a date table: bring one from your data source, generate with DAX, or build it in Power Query.
Each method has trade-offs for governance, control, and speed, and the video walks through those trade-offs with live demos. -
CALENDAR / CALENDARAUTO: For DAX-generated tables, the video shows how to create a calculated table using CALENDAR(StartDate, EndDate) or CALENDARAUTO(), then add year, month, and fiscal columns.
It also explains how to create measures like YTD and test them against the other methods. -
List.Dates: The Power Query approach uses List.Dates in M to generate a date sequence and add attributes before loading the model.
This method gives ETL-style control and makes it easier to manage custom fiscal calendars and precomputed columns. -
Mark as Date Table: The video emphasizes the best practice to mark the date table so Power BI knows which column holds unique date values.
It recommends choosing the method based on governance needs: use a source table for centralized control, DAX for quick in-model fixes, and Power Query for full ETL control; the demos show YTD and fiscal YTD behavior for each case.
Reza Rad (RADACAD) [MVP] has published a practical YouTube video that walks viewers through everything they need to know about the Date table in Power BI. The video focuses on three main approaches and shows live demos so viewers can see how each option behaves in real reports. As a result, the presentation aims to solve a common headache: time-intelligence measures that return wrong numbers despite seemingly correct DAX formulas.
Why a proper date table matters
A proper date table is the backbone of time-based analysis because functions like TOTALYTD, SAMEPERIODLASTYEAR, and DATEADD depend on a continuous date dimension. Without that table, measures may return errors or silently produce incorrect results, which can mislead decision makers. Consequently, the video stresses that getting the date table right is often more important than tweaking DAX formulas.
Moreover, marking a table as a date table tells Power BI which column holds unique date values and helps built-in time intelligence work correctly. The video highlights that Microsoft documents several supported ways to add a date table, but practical reporting typically uses three: a source or existing calendar, a DAX-generated table, and a Power Query-generated table. Each approach has implications for governance, flexibility, and performance that report builders must weigh.
The default or auto date table
Reza explains how Power BI’s built-in auto date table can be convenient for simple reports because it appears automatically and lets you perform basic time grouping. However, he cautions that the default option hides many limitations, such as limited control over fiscal periods, attribute columns, and explicit marking as a date table for advanced time intelligence. As a result, relying on the default dates can lead to surprising behavior when you need custom fiscal years or detailed calendar attributes.
In addition, the video shows that the automatic date logic can complicate governance in larger models because it duplicates date logic across reports rather than enforcing a single definition. Therefore, while the auto table is quick and easy, it often fails when reports require consistent fiscal handling or specialized calendar attributes across an organization. Reza demonstrates these failures in live examples to make the risks clear.
DAX-generated date tables
The second method uses DAX functions such as CALENDAR or CALENDARAUTO to create a calculated table inside the model. Reza walks through the typical workflow: create a new table with DAX, add helper columns for year, month, quarter, and fiscal logic, and then Mark as Date Table in the model tools. This approach is fast and handy when you want to generate a date range directly in Power BI and keep logic tied to the report model.
Nevertheless, the video points out tradeoffs: calculated tables can increase load on the engine and may limit reuse across multiple reports, while complex fiscal rules added as calculated columns can be harder to maintain. In short, DAX works well for quick, report-scoped solutions, but it can introduce maintenance challenges and performance concerns in larger enterprise models. Reza’s live YTD demos illustrate how DAX tables behave compared with other methods.
Power Query and source date tables
The third method covers building a date table with Power Query, often using functions like List.Dates, or connecting to a governed calendar table from the data warehouse. Reza favors Power Query when you need ETL-style control, reusability, and the ability to generate attributes before the data loads into the model. This approach helps standardize fiscal calendars, holidays, and business-specific attributes across reports because the logic runs in the query layer.
Still, this method also has tradeoffs: it requires more up-front effort, skills in M code, and coordination with data teams if the source table comes from a shared repository. Additionally, changes to the calendar logic require query edits and a refresh, which slows iteration for report authors used to quick adjustments. The video balances these factors, showing demos of fiscal YTD calculations to compare results across the three approaches.
Practical guidance and tradeoffs
Ultimately, Reza recommends choosing the method that matches organizational needs: use a governed source table for consistency and control, prefer Power Query for ETL-level transformations, and select DAX when you need quick model-level solutions. He emphasizes marking the chosen table as a date table and testing common time-intelligence measures to confirm behavior, because missed configuration is often the root cause of wrong numbers. These practical checks reduce the risk of silent errors in production reports.
The video gives report builders a clear framework to evaluate tradeoffs between governance, flexibility, and maintenance. In addition, the side-by-side demos help viewers see how Year-to-Date and fiscal comparisons change depending on the approach, which is especially useful for teams deciding how to standardize calendars. Overall, the presentation is a concise, demo-driven guide that helps Power BI users avoid common pitfalls and choose the right date table strategy for their needs.

Keywords
Power BI date table, Power BI calendar table, create date table Power BI, DAX date table tutorial, Power BI time intelligence tutorial, auto date table vs custom, calendar table methods Power BI, Power BI date table examples