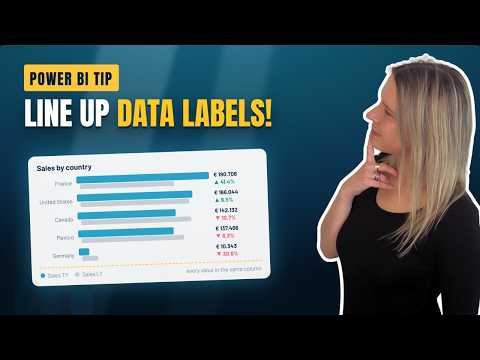
Power BI: Labels with DAX Measures
Lead Microsoft at VisionBI BV
Microsoft expert guides aligning Power BI data labels using DAX helper measures and transparent bars for cleaner reports
Key insights
- Helper measure: Use a helper measure and a helper bar to stack data labels neatly under each bar in Power BI.
Make the helper bar transparent so labels appear aligned and rebuild the visuals to place detail and data labels in the same vertical line. - DAX measures: Create measures for numeric calculations and separate measures for text labels so values stay dynamic.
Measures recalc when visuals render and respond to filters, slicers, and grouping. - Dynamic format strings: Combine FORMAT with measures to show readable values (for example, currency, percentages, or rounded numbers).
This lets you show labels like “Total sales: €2.8M” without changing the underlying calculation. - Evaluation context: Remember that DAX evaluates measures in the current report context, so labels update automatically with user selections.
Prefer functions like DIVIDE to avoid errors when denominators are zero or blank. - Label interpretation: Use conditional logic (for example, SWITCH or IF patterns) to turn numbers into business-facing text such as “On target” or “Slightly below target.”
Interpreted labels improve readability, accessibility, and faster decision-making. - Visualization tuning: After adding the helper bar and labels, adjust spacing and overlap settings to avoid collisions and test across screen sizes.
Small layout tweaks keep labels consistent and make reports look professional.
Video summary and context
In a clear and focused YouTube demonstration, Valerie Junk shows how to keep data labels and detail labels neatly stacked in a Power BI bar chart. She opens by describing the frustrating default behavior where labels "scatter" when space is tight, and she promises a practical workaround using a small visual trick. Accordingly, the video walks through the approach step by step so report authors can reproduce the result in their own dashboards.
Moreover, the presenter emphasizes that this is a layout workaround rather than a built-in feature, and she frames it as a pragmatic authoring pattern for report designers. As she notes, the technique relies on a combination of a helper visual element and careful label formatting, which together produce consistent stacking beneath each bar. Thus, viewers get a repeatable method that fits into common Power BI report workflows.
The technique demonstrated
First, Valerie attempts to align the default detail labels but finds them unreliable because they respond differently to available space and overlaps. Consequently, she creates a helper measure and a narrow helper bar that acts as a spacer, positioning it so labels can sit below the main data labels. Then she makes the helper bar transparent so it no longer distracts visually while it continues to control spacing.
Next, she rebuilds the data labels by combining numeric measures and descriptive text using DAX. For instance, the video shows how to format values and then concatenate interpretation text so that each label reads as both a value and a business statement. In addition, she adjusts label spacing and overlap settings to fine-tune the final layout across different chart sizes and filter contexts.
Step-by-step highlights
Valerie organizes the workflow into small, repeatable steps that match how most report authors work: create or identify the core measure, add a helper measure that defines the spacing, plot the helper as a separate series, and then style it to be invisible. She explains the formula logic for the helper measure in plain terms and shows how the visual order and axis settings affect label placement. Therefore, even users who are new to DAX can follow the sequence and apply it to their own visuals.
In addition, the video includes concrete adjustments for spacing and overlap that help the solution scale when labels change length or when the report audience applies filters. She tests the chart with multiple scenarios—smaller screens, more categories, and different label lengths—to show where tweaking matters. As a result, viewers see both the immediate payoff and the small tuning steps needed for robust results.
Tradeoffs and practical challenges
Although the workaround produces tidy, readable labels, Valerie also highlights tradeoffs that designers should consider when adopting it. For example, adding a helper bar and extra measures increases model complexity and can make maintenance slightly harder, especially if many visuals require the same trick. Moreover, the transparent bar remains part of the visual structure, so it can affect interactions like tooltips or series selection if not configured carefully.
Another challenge involves responsiveness: charts that look good at one size can still require label adjustments on different devices. While the approach is flexible, it also depends on manual tuning of overlap and spacing settings, which means automated or dynamic layouts may still misalign in edge cases. Finally, teams should weigh the benefits of this pattern against alternatives such as custom visuals or newer Power BI features, which may offer cleaner solutions but come with licensing, performance, or learning-cost tradeoffs.
Practical tips and final takeaways
To help practitioners, Valerie suggests keeping the helper logic modular and documenting the purpose of any extra measures so others can maintain the report. She recommends testing with realistic data and common filter states to catch alignment issues early and to avoid surprises for end users. Consequently, small investments in clarity and testing will reduce rework and improve the user experience.
In short, the video provides a practical, low-friction technique for anyone who needs consistent label stacking in Power BI bar charts, and it balances usability with manageable complexity. Therefore, report builders who prioritize clear communication and consistent visuals will find this method helpful, while teams with heavy automation needs may prefer to evaluate alternative approaches. Overall, Valerie’s walkthrough offers a useful pattern and clear guidance for improving label readability in real-world dashboards.

Keywords
Power BI data labels, DAX measures, dynamic labels Power BI, DAX label formatting, conditional labels Power BI, meaningful data labels, Power BI tooltip measures, Power BI labeling best practices