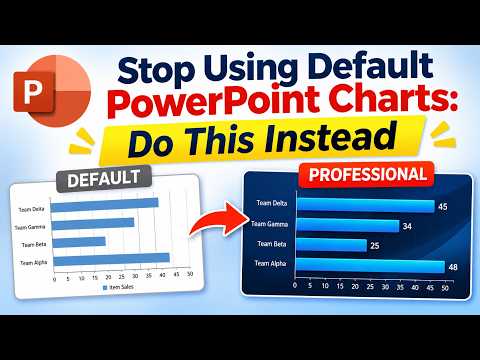
PowerPoint: replace default charts with focused designs
PowerPoint users can turn existing chart data into editable visuals that emphasize a key comparison, trend or target.
Key insights
- Use Chart Design > Edit Data to copy values from an existing chart into another chart.
- The demonstrated line chart automatically highlights the highest and lowest values.
- The bar chart template updates its highlighted lowest value when the data changes.
- For one number, a KPI card may communicate the point more clearly than a chart.
PowerPoint users can replace default-looking charts with editable designs that draw attention to a trend, comparison or target. The approach can help presenters who already have chart data but want a slide that makes its main point easier to see. Presentation Process YouTube demonstrates transferring data from ordinary charts into customized chart templates.
What it does
The method keeps the underlying data in a PowerPoint chart while changing how the chart presents it. In the demonstration, a pie chart, line chart, bar chart and thermometer-style chart use templates designed to emphasize particular information. Examples include highlighting the highest and lowest points in a line chart and marking the lowest value in a bar chart.
The central idea is not to decorate every chart. Choose a visual that supports the specific point: a line chart for change over time, a bar chart for comparing categories, or a thermometer-style display for progress toward a target. A tailored template can make that point more prominent, but the data still needs to be accurate and the chart easy to read.
The demonstrated templates come from a commercial PowerPoint bundle, rather than from a new chart feature built into PowerPoint. The transferable technique is moving data through PowerPoint’s chart editing controls. You can also apply the same design principle when formatting charts you create yourself.
Who it is for and what you need
This approach is aimed at people who build presentations from data, including business professionals and trainers. It is useful when a slide’s default chart styling does not make the important comparison or result stand out. You need a chart with data to transfer, a destination chart, and a clear idea of what the audience should notice.
The demonstration identifies its PowerPoint environment as Office 365. It uses chart templates from the publisher’s bundle, but it does not establish that those templates are included with PowerPoint. If you use a template file, check that it is editable and that its chart type fits your data before building a slide around it.
For a broader set of PowerPoint techniques, the key starting point here is an existing chart whose data can be edited. Small, stable datasets can be managed inside PowerPoint. For larger or frequently changing datasets, the research recommends Excel charts, which can be linked to the presentation so updates to the source data appear in PowerPoint.
How it works
For the examples shown, the chart data is accessed using PowerPoint’s Chart Design tab. The same basic transfer process works by copying the original chart’s values and pasting them into the destination chart’s worksheet. The template may have additional rows or columns to support its visual behavior, so check its structure before replacing everything.
- Select the existing chart and choose Chart Design > Edit Data.
- Copy the relevant data from the worksheet that opens.
- Select the destination chart, then choose Chart Design > Edit Data again.
- Replace the destination chart’s sample values with the copied data, keeping any template-specific structure that the chart needs.
- Check the chart on the slide and confirm that its labels, categories and highlighted values match the intended message.
In the demonstrated line chart, extra columns calculate which points are the highest and lowest. The presenter pastes the data, removes unused rows, and the template highlights those values. In the bar chart example, the lowest value is highlighted and changes when the underlying number changes. These behaviors depend on the structure of the particular template.
The thermometer example works differently: the presenter edits the value in its chart data, and the visual adjusts to show the new level. A funnel pictograph is also shown as editable through its data. These examples illustrate why checking the worksheet matters: two charts may both be editable but use different arrangements of data.
Limitations and alternatives
A template is not automatically the right chart for every dataset. Start with the question the slide needs to answer, then choose a chart that makes the answer clear. A pie chart can become hard to compare when it has many categories; a bar chart may be clearer for ranking values. If only one metric matters, a KPI card may be simpler than a chart.
Keep the design focused. Remove unnecessary borders, backgrounds, legends and gridlines where they do not help explain the data. Use restrained color and direct labels when they make comparisons easier. A custom-looking chart can still confuse readers if it uses unclear labels, unsuitable scales or too many visual effects.
Check the result after pasting values, especially when a template contains helper columns, extra rows or separate charts. Confirm that the labels and highlighted points correspond to the right values, and test how the visual responds when the data changes. If you link a chart to an Excel source, verify that the link remains usable when the presentation is moved or shared; access and file-location changes can interfere with linked data.
Sources
Frequently asked questions
How do I copy chart data in PowerPoint?
Select the chart and choose Chart Design > Edit Data. Copy the values from its worksheet, then open Edit Data for the destination chart and replace its sample data.
Can PowerPoint chart templates highlight the highest and lowest values?
The demonstrated line-chart template highlights both values automatically after data is entered. The bar-chart template shown highlights the lowest value.
Should I create a PowerPoint chart or use an Excel chart?
The research recommends creating charts in PowerPoint for small, stable datasets. For larger or frequently changing datasets, it recommends an Excel chart linked to the presentation.