- All of Microsoft

Optimize Power Platform Canvas App Monitoring with Custom Logging
Enhance your Power Platform canvas app monitoring with Microsofts custom logging. Unveil hidden insights and supervise activities effectively!
Customize Power Apps (software) Monitoring
The following blog post by Frederik Bisback delves into the process of enhancing monitoring capabilities within Power Apps’ canvas application through the implementation of custom logging, using Azure Application Insights for standard insights.
Understanding the reason behind each application's impact is not always a straightforward process. With standard logging, there are a lot of insights to gain. However, this post asks, what happens when we want more? Are there means to get more detailed knowledge about aspects such as user interaction patterns, or the productivity of certain features?
Well, the post dives into managing such specific concerns with a simple method – creating “Custom Logging” with the Trace functionality.
Implementing Custom Logging
One way of unlocking more detailed insights involves adding custom logging with the Trace function. Now, for the how-to section, just imagine you're looking to figure out what's happening behind the scenes of your app, the Trace function plays a crucial role. Using the function in a canvas app makes the trace output visible in the Power Apps monitoring tool. The insights can also be directed to an individual's Application Insights resource if the canvas app has an instrumentation key configured. Tracing can be utilized, primarily, in behaviour formulas.
Each of these logs can then trace an informational message with specific user details, an example feedback value, information about a selected image from a gallery, the length of a message filled in by the end user, or the duration required to add a record to SharePoint list.
How are Trace Information Retrieved?
The blog post further propounds that getting the trace information is easy once the canvas app is integrated with the instrumentation key in Azure Application Insights. Following this, a Kusto query can be run to get said traces. For more specific results, the query can be modified and filtered by different properties such as severity level or custom properties. Once the trace information is obtained, it can be exported to various platforms.
Extracting Valuable Insights
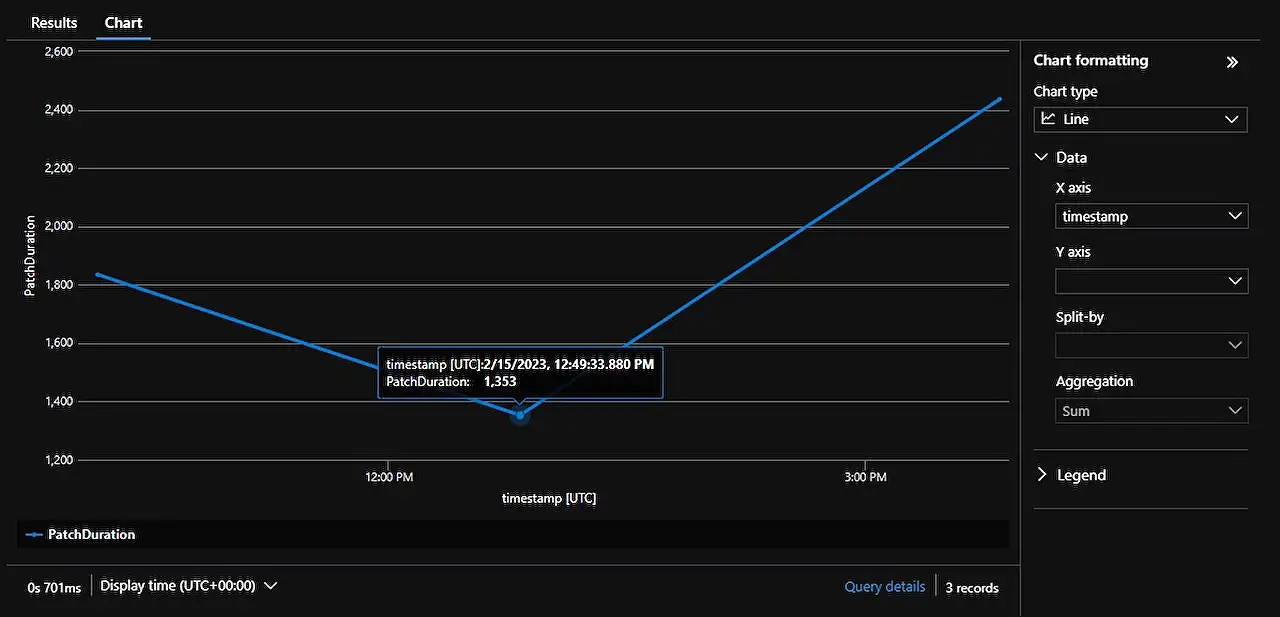
The tutorial then proceeds to detail the extraction of specific information from the gathered data, like the duration of a patch request, stepping in to highlight the retrieval of the same in a systematic and easy-to-understand way. Bisback demonstrates how to use the PatchDuration to represent the output results graphically, in the form of a line chart.
In Conclusion
Bisback's method of custom logging is a great way to track details about your canvas applications, acquire real-time KPIs, and power your BI reporting with new datasets. A challenge remains, however: can we build alerts onto this? Tune in to Frederik's next blog to learn more about integrating Azure Monitor alerts.
Read the full article Get more out of your monitoring! Monitor a Power Platform canvas app with custom logging.

Learn about Get more out of your monitoring! Monitor a Power Platform canvas app with custom logging.
More links on about Get more out of your monitoring! Monitor a Power Platform canvas app with custom logging.
- Debugging canvas apps with Monitor - Power Apps
- Dec 15, 2022 — Sign in to Power Apps. · On the left pane, select Apps. · Select an app from the list. · Select Monitor from the menu. Or, you can select More ...
- Analyze system-generated logs using Application Insights
- May 9, 2023 — Learn how to analyze and use system-generated logs from your canvas apps using Application Insights.
- Use Monitor to troubleshoot custom page behavior in a ...
- Feb 14, 2022 — Monitor can help you debug and diagnose problems with custom pages.
Keywords
Power Platform canvas app, custom logging, monitor app, app monitoring, improve monitoring, enhance app monitoring, custom app logging, Power Platform monitoring, logging power app, monitor canvas app