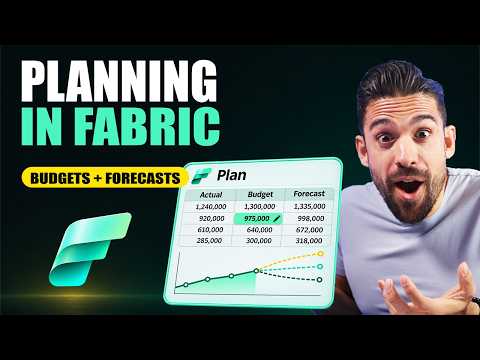
Microsoft Fabric Planning for budgets and forecasts
Microsoft Fabric Planning connects budgets and forecasts to a semantic model, with tools for data entry, forecasting, approvals and reporting.
Key insights
- Planning sheets can connect to a semantic model and support editable plan values.
- The demonstrated setup requires planner sheets, XMLA endpoints and Fabric public APIs to be enabled by an admin.
- A Fabric capacity's XMLA endpoint must be set to read-only or read-write in the demonstrated setup.
- The planning sheet supports top-down and bottom-up changes, cell locking and approval workflows.
- Intelligent sheets can display actuals beside a plan or forecast and include a planning sheet.
Microsoft Fabric Planning brings budget and forecast work into a Fabric experience connected to a semantic model, with planning sheets, forecasting and reporting features. It matters to finance teams and Fabric administrators who want to connect planning inputs with actuals and coordinate review steps. How to Power BI demonstrates a setup that uses a planning sheet, an intelligent sheet and a Fabric SQL connection.
What it does
The demonstration describes three components: planning sheets for creating budgets or forecasts, intelligent sheets for displaying insights and variances, and Power Tables for working with database-connected data in a structured table experience. The planning sheet uses data from a connected semantic model and offers fields, filters, measures and a spreadsheet-like layout. Users can create plan measures, adjust values and distribute changes through the table.
Planning actions shown include top-down and bottom-up input. A user can change a total and have values allocated through regions and product categories, or change a lower-level value and see its effect on a higher-level total. The allocation shown can use a prior period's revenue, with other distribution options also mentioned. Users can lock a cell or its children so later edits do not change those values.
The forecast workflow can create a forecast measure for a selected period. The demonstration uses historical actuals for closed periods and data input for open periods, then runs a prediction using trend decomposition. It also mentions exponential smoothing and ARIMA as available statistical techniques in that workflow. A generated forecast can be saved back to the sheet or exported to CSV.
Intelligent sheets bring comparisons and planning content together. The example adds actuals, a plan and a forecast to KPI and chart visuals, then places a planning sheet on the same intelligent sheet. The presenter also demonstrates approval levels, status columns, Teams notifications and comments. Together, these elements are intended to support review and analysis without switching between the planning grid and a separate reporting view.
Who it is for and what you need
The features shown are aimed at finance planners and the people who administer or support their Fabric environment. The demonstrated task is to build a financial plan against a semantic model, then collaborate with other users through comments and approvals. The source material does not specify required licenses, capacity sizes, regional availability or a rollout stage, so check current Microsoft documentation and tenant settings before planning deployment.
In the walkthrough, an administrator enables three tenant settings: users can upgrade to a planner persona, XMLA endpoints can be used, and service principals can call Fabric public APIs. The presenter also checks the Fabric capacity settings and sets the XMLA endpoint under Power BI workloads to read-only or read-write. These are the setup requirements shown in the demonstration; the material does not establish that they apply identically to every tenant or deployment.
The example imports a sample Power BI file to provide a semantic model, creates a plan item in a workspace, and connects the plan to that model. A database connection is recommended in the interface to enable collaboration for viewers. The presenter shares that connection with the people who will use the planner, so they can access collaboration data such as comments and approval information.
How it works
- In the Fabric admin portal, enable planner sheets, XMLA endpoints and public API access for service principals. In capacity settings, check the XMLA endpoint setting under Power BI workloads.
- Create a workspace on a Fabric capacity and add a Plan item. Connect it to a semantic model. The walkthrough imports a sample PBIX first because its workspace does not yet contain a model.
- Create a planning sheet and configure a database connection for collaboration. Share the connection with the intended users through Manage connections and gateways, then Manage users.
- Build the grid by adding measures to Values, business dimensions to Rows and a date hierarchy to Columns. Use filters to limit the displayed data, then save the sheet.
- From Planning, create a new series or copy from an existing one. The example copies Actuals into a Plan 2027 measure, then adjusts totals or detail values and uses the distribution behavior to allocate changes.
- Use cell locking to protect approved values. For forecasting, configure the period and closed-period behavior, select open-period input, and use Model > Predict to generate a prediction. Review the result, then save it or export it.
- Set approval levels from the Modeling tab's Approval option. The example adds two levels, enables reset behavior if a later reviewer rejects a submission, and turns on Teams notifications. Comments can be added through a comment column.
- Add an intelligent sheet, choose visuals and comparison measures, and insert the planning sheet to show planning content alongside reporting.
Some labels and placements can vary as the product changes; the steps above reflect the demonstration rather than a guarantee that every tenant displays the same interface.
Limitations and open questions
The material does not provide licensing details, a Microsoft rollout announcement, or a definitive statement about preview or general availability. It also does not explain how permissions, data retention, capacity sizing or deployment governance should be configured beyond the settings and connection sharing shown. Organizations should validate those points against current official guidance before using the capability for a controlled finance process.
The example uses a sample semantic model and one plan, so it does not establish performance at enterprise scale or demonstrate a complete production implementation. Nor does it show a writeback destination beyond the plan item's SQL database, or detail how data moves into downstream systems. Spreadsheet-based planning is described as a common existing approach, but the material does not provide a migration procedure from existing files or planning software.
For admins, the practical takeaway is to confirm tenant and capacity settings, then test connection sharing with intended collaborators. For finance teams, assess whether the model, planning dimensions, approval steps and forecast assumptions match the organization's process before relying on the outputs.
Sources
Frequently asked questions
What settings are needed for Planning in Fabric?
The demonstration enables planner sheets, XMLA endpoints and public API access for service principals in the admin portal. It also sets the Fabric capacity XMLA endpoint to read-only or read-write.
Does Planning in Fabric require a semantic model?
The demonstrated planning sheet connects to a semantic model. The walkthrough imports a sample PBIX to create one before connecting it to the plan.
How do you add approvals to a Fabric planning sheet?
The demonstration uses the Modeling tab's Approval option to set approval levels and enable Teams notifications. It does not document every configuration option or permission requirement.
What license or capacity is required for Planning in Fabric?
The available material does not specify license requirements or minimum capacity. It shows a workspace assigned to a Fabric capacity.