Debugging User Sessions with Power Apps Monitor - Guide
Solve issues with power apps using a test user account. Debug sessions with Power App Monitor for a smooth user experience.
Deep Dive into Using Microsoft's Power Apps Monitor for Debugging User’s Session
Microsoft's Power Apps tool provides a robust solution pack for creating custom apps without extensive coding. Sometimes, users may stumble upon certain problems when testing these canvas apps. Case in point here is the author’s recent experience, where a test user account belonging to a team of regular users had some glitches breaking the app functionality. Conversely, the author’s sys-admin account worked perfectly well. The test user was presented with a vague error message, "Error when trying to retrieve data from the network...,” leaving them clueless. The only way out was to directly debug the test account’s session.More information about Power Apps is available here.
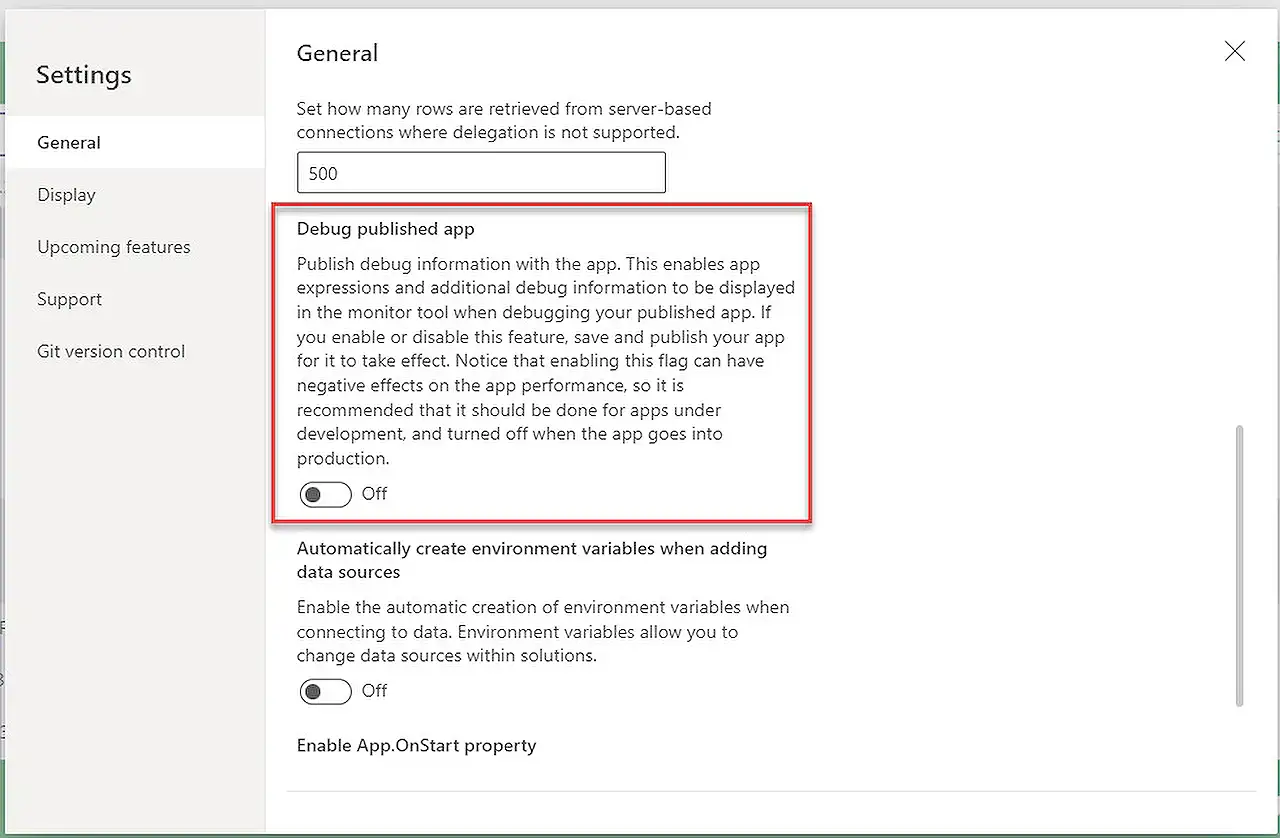
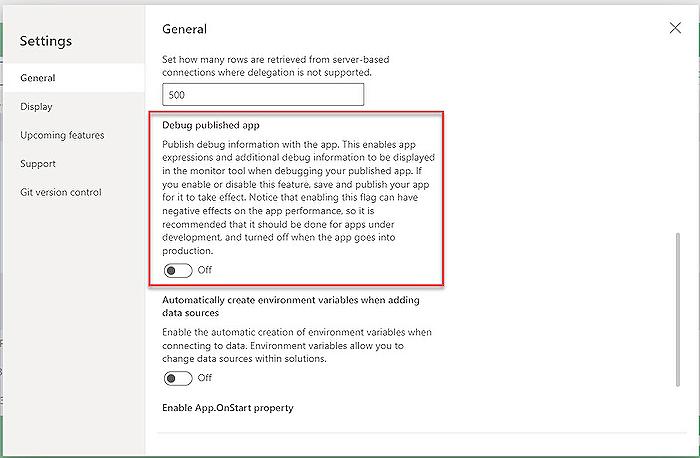
So, how was the issue addressed? A tool called Power Apps Monitor comes handy here. Although this tool may require one to turn on the “Debug published app” option under Settings > General, it doesn’t always have to be the case. Ensure this setting is turned back off and re-publish the app once you are done debugging, since it could affect the app’s performance.
To debug an app, select it from your Apps listing, and choose the Monitor tool. The Microsoft Power Apps Monitor provides a detailed representation of what is going on behind the scenes. For instance, if you wanted to debug a session using your current account, you could select the "Play published app" option. However, if the app works fine with a sys admin user, the "Connect user" functionality becomes handy.
Upon selecting "Connect user", the tool allows you to search for an Active Directory (AD) account which session you wish to monitor. Subsequently, the user is added to the monitoring session and you can pick up the monitoring link, which only works for 60 minutes. For a user to launch the app, a unique link is generated, rather than using the regular link, which connects the test user’s app player session to the ongoing monitoring session.
Note that the user is prompted with a confirmation dialog when entering the session. After consenting with a click on "Join", the participant starts receiving monitoring data in the Monitor. A small red circle indicating an active user session appears on the left upper corner of the screen, so the admin viewing the Monitor can see all data requests made by the user through the app.
When the data starts flowing into the Monitor, it’s easy to identify the problem as visualized in the captured data. The author discovered a problem with fetching views for the test user from Dataverse. Ultimately, the issue was traced back to missing Basic User permissions for the team the test user was part of, causing the user account to lack permission to access any views in Dataverse.
In conclusion, Microsoft's Power Apps Monitor tool proves significantly helpful in facilitating the debugging process. Without it, diagnosing complex issue like the one described here, would have been quite challenging, even though the solution was ultimately trivial.
In the broader discourse, this highlights the importance of tools like Microsoft's Power Apps Monitor in ensuring seamless work processes in a digitized work environment, as it streamlines problem-solving tasks for administrators.
Read the full article Using Power Apps Monitor to debug other user’s session

Learn about Using Power Apps Monitor to debug other user’s session
In our technologically advanced age, mastering Microsoft's Power Apps is a crucial skill for many professionals. This blog post shares insightful guidance on how to use Power Apps Monitor to troubleshoot issues encountered by other users. With this adequate knowledge, you can effectively debug sessions involving various user profiles. To fully comprehend and delve deeper into this topic, you should consider engaging in professional courses and training.
Why Enroll in Microsoft's Power Apps Courses?
- Deep Understanding: Microsoft's courses offer in-depth insights into the workings of Power Apps, helping you handle challenges like debugging sessions effectively.
- Practical Exposure: Structured courses provide hands-on experience, making the learning process practical and user-friendly.
- Enhancing Professional Value: Understanding Power Apps propels your career trajectory, as it's a sought-after proficiency in the current marketplace.
Microsoft's official website provides numerous training courses on Power Apps, from beginner to advanced levels. However, for a more specific focus on the use of the Power Apps Monitor tool, you could consider a course like the 'Unleashing Power Apps Monitor For Debugging Sessions (UPAMDS)'. Here's a brief overview of what you likely would gain:
- Understanding the Power Apps Monitor tool and its features
- Exploring real-time scenarios regarding Power Apps debugging
- Learning to navigate the debug test account's session.
In this course, you'll learn to uncover issues by using the Connect user functionality, which allows you to monitor a session belonging to a different user. It points you to the 'Debug published app' setting in general settings, enabling access to detailed debug information. You'll understand how to generate a monitoring link to connect a test user's session with your ongoing administrative session. The course also guides you on the process of reviewing data, aiding you in identifying software glitches.
In regard to the issue addressed in the blog post, the training addresses problems associated with data retrieval from the network. You'll be able to identify why a user might experience issues with accessing views of certain data sets or tables and devise a successful solution. In a practical demonstration, you would gain insights into how to properly set user permissions to access views in Dataverse.
After completion of the course, you'll be skilled in handling similar situations, thereby improving your app management skills. Understanding and managing data within Power Apps becomes a breeze.
In conclusion, whether you're an enthusiast looking to upskill or a seasoned pro looking to polish your knowledge, don't miss out on training courses like these! They'll leave you better equipped to debug user sessions, ensuring a smooth flow of operations in Power Apps.
More links on about Using Power Apps Monitor to debug other user’s session
- Collaborative troubleshooting using Monitor - Power Apps
- Aug 22, 2023 — Monitor offers two features to enable collaborative troubleshooting and debugging of canvas and model-driven app problems in Power Apps:.
- Using Power Apps Monitor to debug other user's session
- Jan 23, 2023 — Open Monitor. Go to your Apps listing, select the app you want to debug and choose Monitor. You have now entered Monitor!
- Debugging canvas apps with Monitor - Power Apps
- Dec 15, 2022 — Open Monitor for a published app · Sign in to Power Apps. · On the left pane, select Apps. · Select an app from the list. · Select Monitor from the ...
Keywords
Power Apps Monitor, Debug User Sessions, Microsoft Power Apps, Power Apps troubleshooting, User Session Debug, Power Apps Debugging, Monitor Power Apps, Power Apps User Session, Power Apps Debug Session, Power Apps Monitor Debugging