
Using Figma to wireframe your Power BI reports
You care about how your Power BI reports look. Sekou joins us to explore using Figma to wireframe your report design and get that look you want before doing all
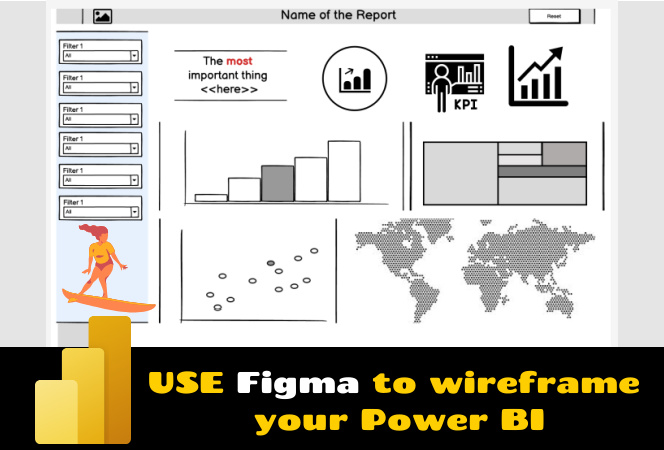
Using Figma is an effective method for wireframing Power BI reports. The aesthetics and design of your Power BI reports play a significant role, and Figma contributes towards achieving a desired look. Sekou joins us in this exploration to demonstrate applying Figma for wireframing report designs. The intent is to help you visualize the final look before engaging in the actual laborious task within Power BI Desktop.
- Figma: A platform for wireframing Power BI reports
- Beneficial for pre-visualization of Power BI reports' designs
- Sekou's demonstration of Figma's application in wireframing
- Objective: To achieve a desired look for the reports before proceeding with Power BI Desktop.
Expanding on the Use of Figma
Figma is a cloud-based UI design tool that enables creatives to collaborate in real-time. It's an excellent wireframing tool, particularly for Power BI reports, aiding in the effective visualization of the potential report design. Sekou's demonstration emphasizes the goal to achieve a desired aesthetic for your reports before delving into the demanding task within Power BI Desktop. Harnessing the functionality of Figma could be the key to optimized report design and improved efficiency in Power BI tasks.
Learn about Using Figma to wireframe your Power BI reports
Creating a well-designed Power BI report requires careful planning and attention to detail. Figma is a powerful, user-friendly design tool that can help streamline your report creation process. With Figma, you can wireframe your report before you ever open Power BI Desktop, giving you the opportunity to test out different design options, experiment with different visualizations, and get the look you want before doing the hard work of building your report.
Figma is an online design platform that can be used to create user interface designs, wireframes, and prototypes. It features a simple and intuitive drag-and-drop interface that makes it easy to design complex layouts for your Power BI reports. With Figma, you can quickly create mockups of your report design, try out different visualizations, and make sure the report is aesthetically pleasing before you move on to the more technical aspects of report building in Power BI Desktop.
Figma also allows you to collaborate with other designers and developers who may be working on the same project. With its powerful commenting and version control features, Figma makes it easy to collaborate on projects and ensure that everyone is on the same page.
Using Figma to wireframe your Power BI reports is a great way to streamline your report creation process and make sure you get the look you want. With its easy-to-use drag-and-drop interface and powerful collaboration features, Figma is a powerful tool that can help you create beautiful, well-designed Power BI reports quickly and efficiently.
More links on about Using Figma to wireframe your Power BI reports
- Wireframing in Power BI
- Jul 29, 2023 — Figma is specialized software for wireframing Power BI reports and Dashboards. It is designed to make the process quick and easy, with various ...
- power BI wireframe | Figma Community
- power BI wireframe. By himanshu pandey. |. Used by 238 people. Open in Figma. This is a Figma Community file. Community is a space for Figma users to share ...
- Connect Figma and Microsoft Power BI integrations
- Connect Figma and Microsoft Power BI to sync data between apps and create powerful automated workflows. Integrate over 1000 apps on Make.
- The Complete Guide to Designing a BI Dashboard Mockup
- Jul 21, 2022 — A wireframe is a low-fidelity rendering of what the dashboard could look like with some actual charts and graphs represented. Tools like ...
- Power BI Wireframe Template
- Nov 9, 2021 — Build Power BI reports using pre-made layout, easy to follow guidelines, drag & drop elements and charts. Whether you're creating new report ...
Keywords
Power BI wireframing, Figma design, Figma Power BI, Report design, Wireframing tool