Copilot Studio: One Prompt, Data Story
Currently I am sharing my knowledge with the Power Platform, with PowerApps and Power Automate. With over 8 years of experience, I have been learning SharePoint and SharePoint Online
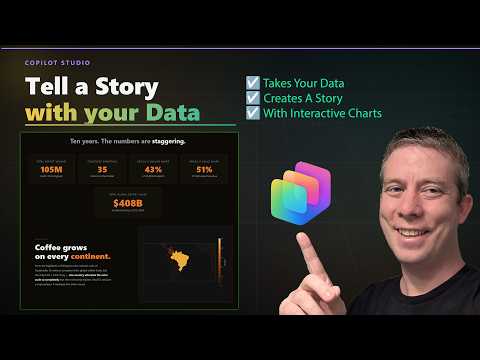
Microsoft Copilot Studio turns Excel and Dataverse into scrollytelling HTML with animated charts and auto summaries
Key insights
- Copilot Studio
Microsoft's Copilot Studio lets teams turn datasets into narrative data stories using agent-driven prompts. It focuses on dynamic, enterprise-grounded storytelling instead of static reports. - Custom prompt
Create a single natural-language prompt in AI Builder or Copilot Studio that tells the agent how to analyze and narrate data. One well-designed prompt can produce summaries, trend analyses, or KPI highlights. - Prompt action
Register the prompt as a Copilot action and call it from any agent or topic. The agent runs the prompt with connected data and returns a consistent, structured narrative. - Data sources (Dataverse, Excel, CSV, JSON, PDF tables)
The system accepts common enterprise sources and live Dataverse tables, so stories reflect current business metrics without extra coding or ETL work. - Scrollytelling & interactive output
The tool creates scroll-driven HTML stories with animated charts, maps, heatmaps, and stat cards that build as you scroll. It exports a fully self-contained HTML file you can share and open in any browser. - Benefits & use cases
Teams gain no-code automation, repeatable and predictable outputs, and scalable agents. Use it for executive summaries, stakeholder briefings, and making data approachable for non-technical audiences.
Introduction
Andrew Hess, known for his MySPQuestions channel, demonstrates a practical tool in a recent YouTube video titled Turn Your Data Into a Story w/ (1) Prompt in Copilot Studio. In the video, he showcases a custom Copilot Studio skill called scrollytelling-data that converts datasets into a scroll-driven HTML narrative. The demonstration emphasizes that users can upload Excel, CSV, JSON, Dataverse tables, or even PDF tables and receive a finished, self-contained story. Consequently, the result aims to make data presentations more engaging for non-technical audiences.
Hess walks viewers through the whole process and highlights key features such as animated charts, stat cards that count up, and automatically generated narrative chapters. Moreover, he notes that the output requires no server, no install, and minimal design skills to share or publish. The clip includes real examples like World Cup data and Dataverse-driven summaries to illustrate how the tool adapts to different datasets. Therefore, the video positions the approach as a practical, no-code pathway to better data communication.
What the Video Demonstrates
First, the video shows how a user uploads a dataset and quickly gets a finished data story that animates as the reader scrolls. Hess explains that charts such as maps, bar charts, trends, and heatmaps build organically within the narrative so that readers encounter visuals in context. He also demonstrates auto-generated chapters and a greeting that frames the story, making it feel like a guided walk-through of the data. As a result, viewers can see how a single prompt can orchestrate both narrative and visual elements.
Second, the clip covers a variety of dataset types to prove the skill's flexibility and robustness. For instance, Hess tests the approach on football tournament statistics and then on a Dataverse table to show enterprise use cases. He also highlights a deeper “Deepdive Skill” example to show how the method can scale into explorations of specific metrics. Thus, the video balances simple demonstrations with scenarios that mirror real business needs.
How the Technology Works
At its core, this capability relies on Microsoft Copilot Studio and prompt-driven actions created in AI Builder. Users create a custom prompt that defines the narrative intent, bind it to a Copilot action, and point it at the desired data sources such as Dataverse or a CSV file. When the agent runs, it executes that prompt with the data as input and returns structured narrative text and the interactive HTML scaffolding. Consequently, the process reduces the need for traditional report-building code or separate visualization tooling.
Importantly, Hess emphasizes that the output is a standalone HTML file, which means recipients can open it in a browser without special software. This design decision simplifies sharing and archiving, and it keeps deployment lightweight and portable. However, the single-file approach trades off dynamic server-side refresh capability for portability, which is a critical consideration for live dashboards. Therefore, teams must choose between self-contained distribution and continuous live updates based on their needs.
Benefits and Tradeoffs
The approach offers clear benefits: it lowers the barrier to producing narrative data products, speeds up delivery with a single prompt, and grounds outputs in enterprise data when connected to Dataverse. Moreover, the predictable structure helps organizations standardize how they communicate KPIs and trends across teams. Yet, tradeoffs exist because relying on a single prompt increases sensitivity to prompt wording and data formatting, which can affect output quality and consistency.
Additionally, automated storytelling helps non-technical readers, but it can obscure the underlying analysis if teams do not preserve provenance and context. In practice, organizations must balance the convenience of auto-generated narratives with the need for auditability and validation. Consequently, governance, prompt versioning, and clear data labeling become crucial to maintain trust in automated stories.
Challenges and Adoption Considerations
Several operational challenges could slow adoption even as the tool demonstrates clear promise. First, integrating live enterprise sources requires careful attention to permissions and data privacy, since automated prompts may surface sensitive information if not properly scoped. Second, large or complex datasets can tax client-side rendering and reduce performance in a single-file HTML approach, which means teams may need to pre-aggregate or sample data for the best experience.
Moreover, maintaining prompt quality over time is not trivial because business priorities and data schemas change. Teams will need processes for testing prompts, documenting expected outcomes, and updating prompts when metrics evolve. Finally, accessibility and mobile performance deserve attention, since animated visuals and scrollytelling layouts must remain usable for a broad audience. Therefore, adoption plans should include design checks, governance steps, and performance tests.
Conclusion
Andrew Hess’s video presents a compelling example of how AI-driven prompts in Copilot Studio can transform static datasets into engaging narratives. By combining simple uploads, a single prompt architecture, and self-contained HTML output, the approach makes data storytelling faster and more accessible to non-technical audiences. At the same time, organizations must weigh tradeoffs around live updates, governance, prompt maintenance, and performance when deciding how to deploy the capability.
In short, the video offers both inspiration and practical detail for teams exploring no-code data storytelling, and it points toward real operational steps for evaluation and rollout. As this technology matures, teams that pair prompt governance with data stewardship will likely gain the most value while managing the inherent risks. Ultimately, the demonstration invites readers to test the balance between speed and control when turning their data into stories.

Keywords
Copilot Studio prompt tutorial, turn data into a story, data storytelling with Copilot, prompt engineering for data stories, AI data storytelling guide, Copilot prompts for analytics, Copilot Studio demo and walkthrough, Microsoft Copilot Studio data visualization