
Top 5 FREE Custom Power BI Visuals
Discover the top 5 FREE custom Power BI visuals. Maximize your data visualization with our experts pick for best Power BI features.
Title: Unleashing the Top 5 Complimentary Customized Power BI Visuals Revealed
The well-known digital content creator, Pragmatic Works, recently posted an informative and insightful YouTube video discussing the top five customized Power BI visuals that are available at no cost. More information about Power BI can be found here.
The video provides a comprehensive look into the world of Power BI's interactive data visualization. It explains how these visuals can enhance data analytics and deliver diversified business insights out of everyday raw data.
Here are the top five free customized Power BI visuals revealed in the YouTube video:
- Synoptic Panel: This tool paints geographic, schematic, and overall flow diagrams that are highly interactive and interest-catching.
- Violin Plot: The Violin Plot helps in illustrating the distribution and frequency of data sets, providing a deeper level of understanding about data dispersion.
- Smart Filter Pro: This visual offers a slicer with the ability to search text and select multiple items, allowing for a highly interactive and comprehensive presentation.
- Radar Chart: This chart facilitates a glanceable overview of multiple data attributes and comparison within a single illustration.
- Small Multiples Line Chart: This visualization is excellent for representing trending data over a specified period in an easy-to-comprehend format. It is aesthetically pleasing and informative.
These visuals can be highly useful for any organization seeking to get the most from its data analysis. They offer intuitive interfaces that make analytics more understandable and accessible.
Power BI: A Window to Enhanced Data Visuals
Business Intelligence systems like Power BI have emerged as vital tools in today's data-driven era. Understanding data and translating it into actionable insights is a necessity for businesses to stay competitive. Power BI's custom visuals help in making data more digestible and meaningful, enhancing decision-making capabilities. From pictorial representations to trend analysis, these tools not only simplify complex data sets but also allow businesses to draw significant insights from their data. As the digital ecosystem continues to evolve, Power BI is likely to remain a key player in the world of data analytics.
After the third mention of Power BI, we shall use alternative names like "this analytical tool" or "data visualization platform".
The video by Pragmatic Works is a must-watch for any business or individual interested in leveraging data for better decision-making. It not only provides a detailed overview of free visuals available but also help users make swift, informed decisions based on the visualized data.

Learn about Top 5 FREE Custom Power BI Visuals
In this article, we will delve into the realm of visual data representation with Power BI, a leading business analytics tool developed by Microsoft. The focus is learning and using various Power BI visuals and how they can be tailored to suit specific data analysis needs.
Foremost, let’s take a look at some widely used Power BI visuals:
- Key Performance Indicator Matrix (KPI Matrix): This visual enables users to measure and contrast performance using predefined indicators. It provides an intuitive interface for monitoring fluctuations in KPIs.
- Text Filter: This versatile visual promotes quick data filtering through the input of a text string, underpinning both partial and case-sensitive text searches.
- Bar Chart: This visual offers a straightforward method of depicting data in the familiar bar chart format, facilitating the comparison of values within multiple categories.
- Sunburst: Interactive and innovative, this visual is a popular choice for examining hierarchical data, enabling users to recognize patterns and contrast values within varying hierarchical levels.
- Single Value or Metric Card: A functional visual that presents a single value or metric, useful for comparing values or spotlighting KPIs.
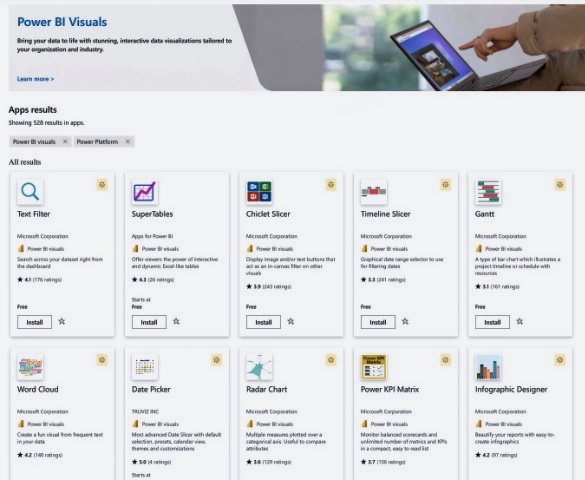
The steps to access these custom visuals are simple. Power BI users, after logging into their accounts, can access these visual tools on-demand, perfectly suit their reports.
Apart from these common visuals, Power BI supports a broader catalog of custom visuals, which developers have crafted using the custom visuals SDK. These visuals are shared within an organization or uploaded in Microsoft's open-source platform AppSource, where they can be accessed and imported by users to their Power BI reports.
Remember, Microsoft and community members develop and share Power BI custom visuals in the AppSource for public benefit. Microsoft tests these visuals to ensure they are both functional and offer quality.
What differentiates certified Power BI visuals from AppSource visuals is their rigorous quality checks, which ensure these visuals don't access external services or resources.
Developing a skill set and becoming proficient with Power BI visuals requires time and understanding of your data analysis requirements. Microsoft provides a wealth of resources, such as an organizational store or AppSource to assist in gaining this knowledge. To stay ahead, actively participating in the Power BI community forums is also a great way to learn from others' experiences, seek advice and keep up-to-date with new features and trends in data visualization using Power BI.
No matter whether you are an occasional user or a seasoned developer, learning to utilize Power BI’s custom visuals will serve to enhance your reports and deliver comprehensive insights into your data. This depth of understanding will subsequently help in driving business decision-making, strategic planning, and ongoing organizational development.
There are several educational resources available online to learn more about Power BI visuals, including Microsoft's official documentation, free or paid online training courses on platforms like Coursera, Udemy, or LinkedIn Learning, and tutorials on YouTube. In addition to these, regularly accessing and using resources provided by Microsoft, including the Power BI community, AppSource, and organizational stores, will greatly assist in improving your Power BI skills.
Keywords
Free Power BI visuals, Custom Power BI visuals, Power BI customization, Best free Power BI visuals, Power BI visuals modify, Top free Power BI visuals, Free custom visuals Power BI, Recommended Power BI visuals, Power BI visual guide, Power BI visuals free download.