
Power BI Tutorial: Master New Slicer & Card Visuals
Microsoft MVP | Author | Speaker | Power BI & Excel Developer & Instructor | Power Query & XLOOKUP | Purpose: Making life easier for people & improving the quality of information for decision makers
Revolutionize Data Analysis with Power BIs New Slicer & Visuals - Dive into a World of Insights!
Key insights
Introducing the Button Slicer in Power BI: The Access Analytic team is thrilled to unveil the button slicer, a new addition to the Power BI slicer experience. This enhancement arises from user feedback seeking more customization and an easier slicing experience. The November upgrade is set to significantly improve how users interact with data, introducing a flexible and user-friendly alternative to the traditional tile slicer.
- The button slicer is designed for greater customizability, challenging the limitations of the tile and chiclet slicers by offering a novel, enhanced user experience.
- Users can easily set up and format the button slicer, adjusting its appearance through the on-object edit icon and accessing comprehensive formatting settings. Features like adjustable grid layout and corner radius customization enhance design flexibility.
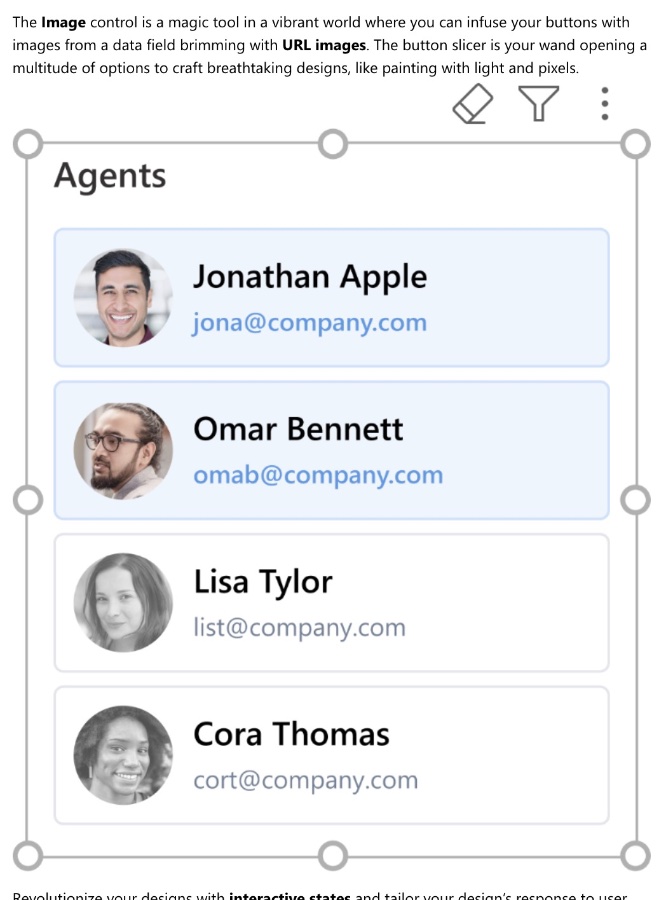
- The button slicer introduces innovative elements such as image control, interactive states, and a multi-select feature without the need for CTRL pressing. These improvements aim at making data visualization more engaging and efficient.
- Tooltips support for both default and report page tooltips enriches user experience, guiding through data with greater clarity. This paves the way for advanced data exploration and insight generation.
- The future roadmap for slicers in Power BI includes stages for diverse slicer types, such as list, dropdown, slider, calendar, and relative slicers, demonstrating a commitment to continuous enhancement based on user feedback.
Read the full article The Amazing New Slicer and Card visual in Power BI (Tutorial)
Revolutionizing Data Visualization with Power BI Slicers
The advancements in Power BI slicers, prominently highlighted by the introduction of the button slicer, signify a leap forward in data visualization and interactive reporting. This initiative marks a transition from static, rigid designs to dynamic, customizable interfaces that empower users to explore data in an intuitive, efficient, and visually appealing manner. Beyond mere aesthetic upgrades, these slicers are equipped with functionalities that simplify user interaction - from seamless multi-selection capabilities to enhanced tooltip integrations. The roadmap for future slicer developments underscores a strong, user-centric approach, promising an evolving platform that adapts to the diverse needs and feedback of its users. Overall, as Power BI continues to evolve, it firmly establishes itself not just as a tool for data analysis, but as a canvas for creativity, enabling users to craft compelling stories with their data.
Exploring the Evolution of Power BI
Power BI continues to push the boundaries of data visualization and business analytics, offering users around the globe innovative tools to transform raw data into compelling, actionable insights. Its latest such innovation, the button slicer, perfectly encapsulates the software's commitment to user-centric design and functionality.
This evolutionary step is not just about enhancing the aesthetic appeal of reports but about redefining user interaction with data. By introducing elements like the button slicer and new card visual, Power BI is significantly reducing the effort and complexity involved in data analysis.
Customization and flexibility lie at the heart of these updates, allowing users to tailor their data exploration experiences to their exact needs. From adjusting the visual appearance to leveraging advanced interactive features, these tools are designed to make data more accessible and engaging.
The significance of these innovations goes beyond mere convenience. By making data visualization more intuitive, Power BI is helping businesses of all sizes unlock their potential, informing better decisions through clearer insights. It's a testament to the platform's continual evolution in response to the needs of its users.
As the journey of Power BI unfolds, with features such as multi-select capabilities and enhanced tooltips, the platform sets a new standard in the industry. It reassures users of its commitment to not only meet but exceed their data analysis and visualization needs.
Looking towards the future, Power BI's planned updates, including more slicer varieties and interactive possibilities, promise to keep the platform at the forefront of the digital transformation era. For data analysts and business professionals alike, Power BI represents a crucial ally in navigating the vast seas of data, offering a beacon of insight in an often complex digital world.
Power BI’s New Features
- The new button slicer offers unparalleled customization, ease of use, and is a response to user feedback.
- It surpasses the outdated tile slicer with flexibility, aiding in quicker, data-driven decisions.
- Slicers, a crucial report component, get a significant upgrade with the button slicer, enhancing report creation.
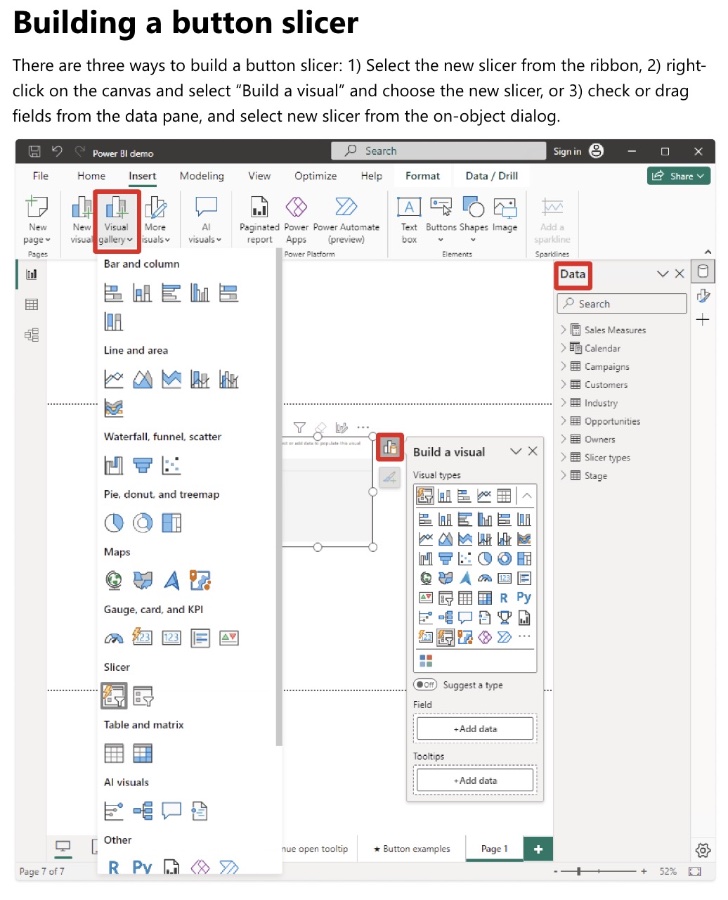
The tutorial illustrates how to set up and format the new slicer, including selecting it from the ribbon, adjusting its appearance, and customizing its layout. The button slicer's formatting options, like corner radius changes and grid layout customization, are easy to follow.
It introduces innovative features like the Image control and interactive states to enrich your designs. Also noteworthy is the slicer’s support for multi-select features and improved tooltip functionality. The tutorial is excited about the future of the new slicer roadmap.
People also ask
"How do I make my Power BI slicers look better?"
As a starting point, select the slicer you wish to enhance visually. Once selected, you'll be presented with a variety of formatting options within the formatting options palette. These options span across various aspects such as the type of slicer, its color, font, orientation, and much more, enabling you to tailor its appearance to your preference.
"What is the new slicer visual in Power BI?"
The latest slicer visual can be accessed within the visual gallery found in the ribbon, or through the on-object dialog. It's important to note that activating the preview feature isn't necessary as it comes enabled by default. To find this feature, navigate to Options > Preview features > New card visual.
"What is the difference between slicer and slicer new in Power BI?"
The new slicer stands out by offering Enhanced Customization Options, allowing for the addition of background images and alterations in shapes, fonts, sizes, and more. Compared to the default slicer, the new version offers a wider array of options for color customization and functionality, marking a significant improvement.
"How do I make my Power BI card look good?"
To enhance the aesthetic appeal of your new card, begin by clicking on the on-object edit icon. Following this, select the 'More options' button to open the format pane. Here, a comprehensive range of formatting settings will be available for you to choose from, enabling you to customize the card's style as per your liking.
Keywords
Power BI Slicer Tutorial, Amazing New Slicer Power BI, Power BI Card Visual Guide, New Slicer and Card Visual Power BI, Power BI Visuals Tutorial, Power BI Slicer and Card Tips, Enhance Power BI Reports Slicer Card, Slicer Card Visual Power BI Features, Power BI Tutorial for Beginners, Advanced Slicer Card Techniques Power BI