Mastering Summary Statistics in Power BI: A Guide
Master Power BI Summary Statistics: Calculate Metrics Like a Pro
Key insights
The Summary Statistics Calculation Group in Power BI allows users to rapidly compute and visualize key metrics like mean, median, and standard deviation.
It is an effective tool for handling large datasets and extracting trends and patterns from various types of data including sales and customer feedback.
Pragmatic Works offers discounted On-Demand Learning resources for further training on Microsoft platforms including Power BI and others.
The tutorial covers key functionalities within the software such as creating and testing calculation groups and applying them to tables.
There are promotional offerings and educational content available for personalized learning and professional development in Microsoft technologies.
Power BI Summary Statistics Calculation Groups
Power BI’s Summary Statistics Calculation Group feature is a compelling tool that enhances data analysis. It streamlines the process of quantifying and visualizing essential statistical metrics essential for any data-driven business or individual. By simplifying the analytics workflow, it can save considerable time and improve the accuracy of insights derived from data.
These calculation groups support a variety of operational decisions by making it easier to spot trends and patterns that may not be evident at a glance. This functionality is crucial for those managing large volumes of data across various industries. The tool's capability to compute averages, sums, and other statistical markers makes it a staple in the toolkit of any Power BI user.

In the latest tutorial from Pragmatic Works, viewers are taught how to utilize the Summary Statistics Calculation Group feature in Power BI. This tool simplifies the process of computing and visualizing critical metrics like mean, median, and standard deviation. For anyone working with extensive datasets, this feature is invaluable in extracting meaningful insights swiftly.
The tutorial emphasizes how Calculation Groups can aid in the analysis of various types of data, including sales figures and customer feedback. Through this feature, users can easily identify trends and patterns that might not be immediately evident. This can be a game-changer for businesses looking to make data-driven decisions.
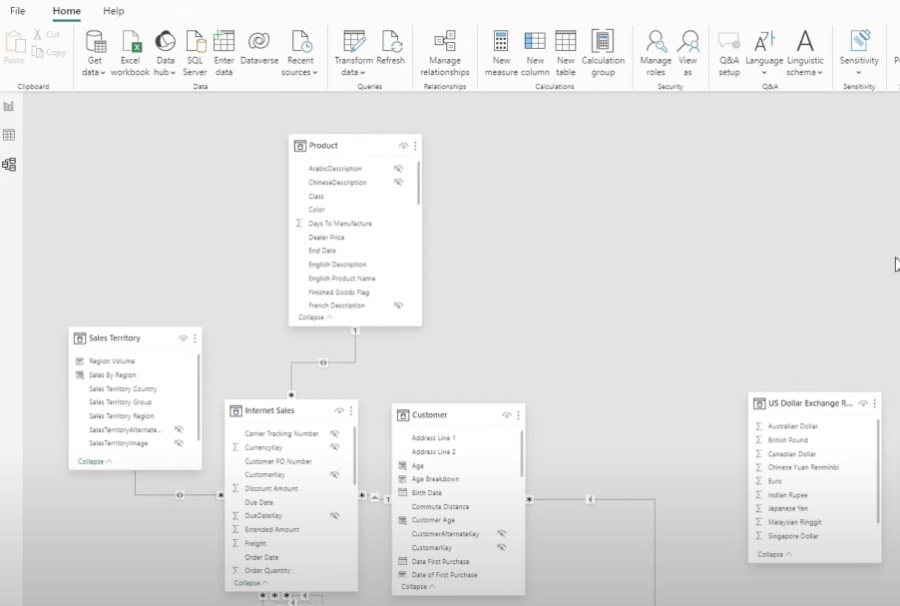
The video begins with a basic introduction to Calculation Groups and progresses through the steps of accessing the Model View, creating Calculation Groups, and naming them. As the tutorial advances, it details the process of defining Calculation Items like sum, average, minimum, and maximum, concluding with practical tests in the Report View.
The step-by-step guidance provided in the tutorial ensures that even beginners can follow along and apply these features effectively in their reports. The integration of Calculation Groups into tables is also demonstrated, offering a practical application that viewers can replicate in their projects.
Pragmatic Works, known for their comprehensive training solutions on Microsoft products, offers various on-demand learning plans and other educational resources. Although the video makes mention of promotional discounts and further training modules, these are primarily aimed at enhancing the viewer's learning journey through additional structured formats.
For more information on upcoming tutorials or additional resources, individuals interested in deepening their understanding of Microsoft tools can visit the Pragmatic Works website. They provide a range of learning options from boot camps to virtual mentoring, tailored to fit different learning needs and schedules.
The tutorial posted by Pragmatic Works does a remarkable job in demystifying the process of creating and applying Calculation Groups in Power BI. This feature not only enhances the efficiency of data analysis tasks but also helps uncover critical insights that can significantly influence business strategies.

People also ask
## Questions and Answers about Microsoft 365"How to group calculations in Power BI?"
In Power BI, to incorporate a calculation group in your data model, you should navigate to the model view and select the 'Calculation group' button from the ribbon. This action prompts a dialog box that warns about the deprecation of implicit measures with the addition of a calculation group. Approving by clicking 'Yes' will proceed with adding the group to your model.
"What are the benefits of calculation groups in Power BI?"
Calculation groups importantly streamline your work by consolidating repeated measures into grouped calculation items. They are instrumental in optimizing your model's efficiency and are enabled in tabular models who operate at or exceed the 1500 compatibility level.
"What is a DAX calculation group?"
In DAX, a calculation group is utilized to forge a collection of calculation items that can be universally applied across different measures. This is particularly useful for executing comparative analyses across multiple periods or scenarios, hence avoiding the redundancy of code replication.
"How to create a measure group in Power BI?"
To organize measures into a group in Power BI, you essentially follow a similar approach to creating calculation groups but focus specifically on grouping measures to enhance model organization and performance.
Keywords
Power BI Summary Statistics, Summary Statistics Power BI, Calculate Summary Statistics Power BI, Power BI Statistics Group, Power BI Data Analysis, Power BI Reporting Features, Data Grouping Power BI, Power BI Analysis Techniques