
Create Interactive Budget & Analysis Excel Dashboard
Learn to Build an Excel Dashboard: Compare Budget & Actuals with Ease!
Set up an Interactive Spreadsheet Dashboard for Budget, PY, vs. Actuals (plus how to show change) In this step-by-step tutorial, you will learn how to create a dynamic and interactive spreadsheet dashboard from scratch. It's designed to compare Actuals with Budget and Previous Year data, utilizing different formulas to match and find the correct rows. The Actuals are on a different sheet and need different lookup methods.
XLOOKUP is the suggested formula, but for those without this function, Index Match is also viable as a lookup alternative. The tutorial explains how to retrieve budget data, requiring the matching of both rows and columns, demonstrating the use of XLOOKUP for this purpose.
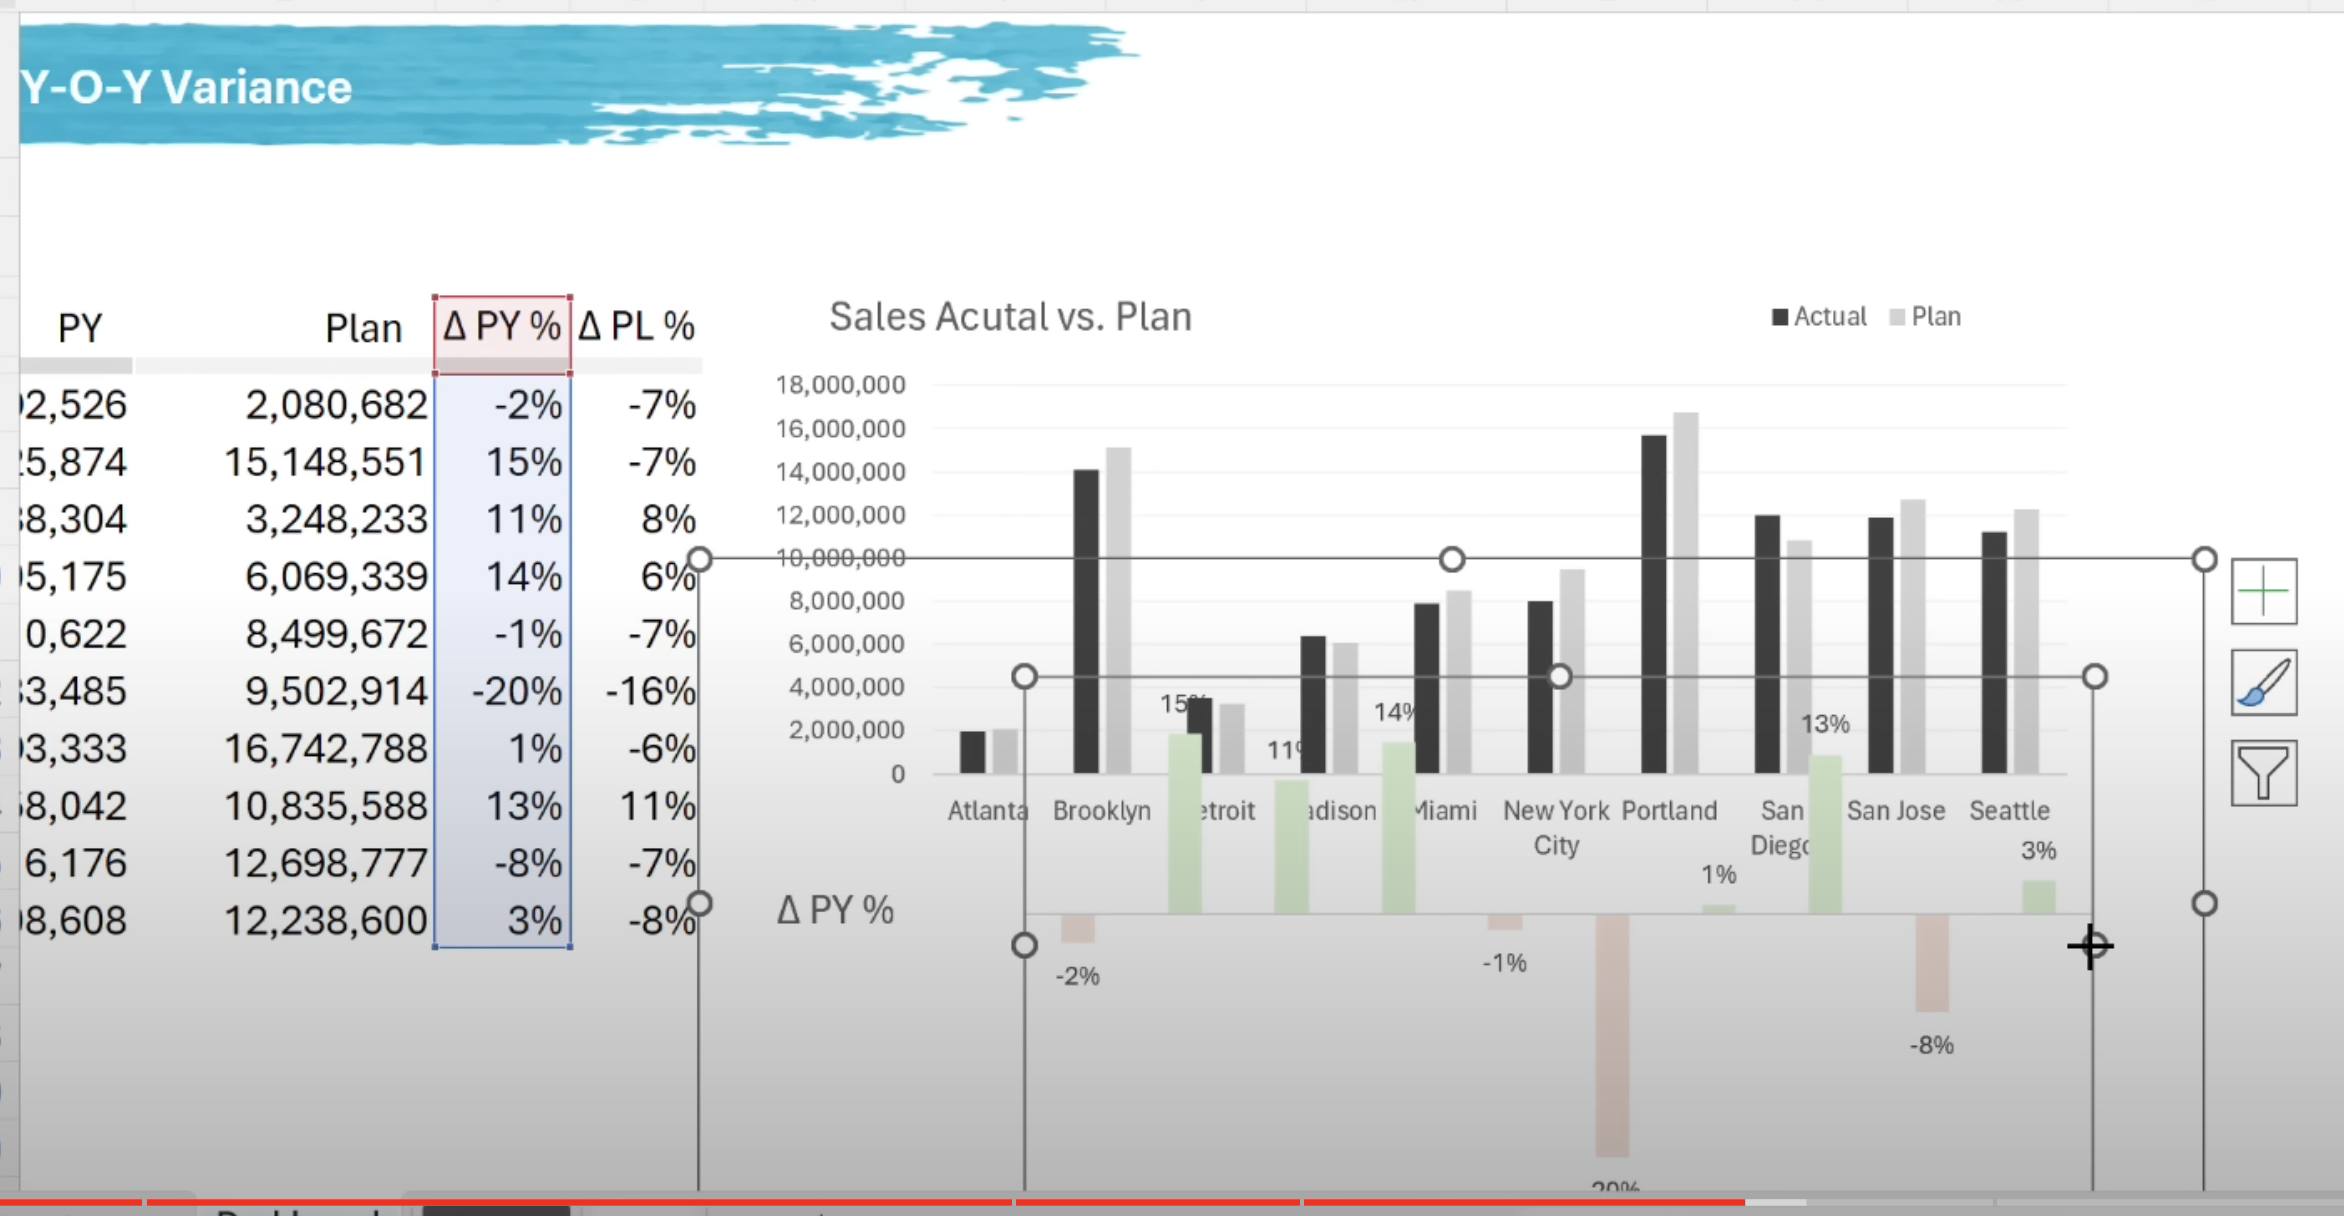
The instructor introduces a month selection drop-down and explains how to use a formula to grab the current year data. Variance calculations, such as percentage change, are next on the agenda. With this information, the creation of a column chart helps compare current and previous year data and uses bars to display the variance—green bars for positive values and red bars for negatives.
The tutorial ensures interactive elements, such as dynamic charts that visually distinguish between gains and losses. These teaching points aim to refine your skills in visualizing sales, budget numbers, and variance analysis into a comprehensible and impressive dashboard.
The content timeline is as follows:
- 00:00 – Overview of how to create an Interactive Dashboard
- 00:53 – Setting up the Data
- 02:20 – Adding a Drop-Down for Month Selection
- 07:49 – Computing Variance between Actuals and Previous Year/Budget
- 09:37 – Creating Visual Insights
Creating an Interactive Excel Dashboard
In this detailed tutorial, we learn to create a dynamic and interactive dashboard using Excel. The process involves comparing 'Actuals' to 'Budget' and 'Previous Year' data. It requires a thorough understanding of handling actual financial data, which is typically stored on another sheet within an Excel workbook.
Since the 'Actuals' data often has a different structure, a special formula is needed to pull relevant data by matching values across multiple columns to find the correct data rows. There are various formulas one could use, including XLOOKUP, or the combination of Index and Match for those without access to XLOOKUP.
Furthermore, to incorporate 'Budget' data from a different sheet, matching both rows and columns is necessary. This can again be done using either Index Match or XLOOKUP, with the tutorial providing an example of how to use the latter approach.
The tutorial also demonstrates how to add a month drop-down and utilize formulas to target the current year's data. Moving forward, it covers the computation of variances, specifically the percentage change between different data sets.
To present this data, the tutorial guides users on creating a column chart for comparing actual and previous year figures, and bar charts showing the variance. A key excel feature is used to color-code the data, presenting positive values in green and negative values in red dynamically.
Understanding Excel Dashboards
Dashboards created in Excel allow users to distill large data sets into simple visual insights, making complex analyses more accessible. They serve as powerful tools for monitoring financial performance and pinpointing areas of significant change. Attention is given to ensuring visuals communicate data effectively by using color-coding and chart types strategically. The result is a polished, professional-looking dashboard that highlights crucial financial metrics and trends with precision.
Enhancing Data Presentation in Spreadsheets
Crafting an engaging and functional spreadsheet dashboard enhances the decision-making process by bringing critical financial data to life. It allows users to effortlessly pinpoint trends, draw comparisons between different periods, such as year-over-year performance, and assess budget adherence. Similarly, identifying financial discrepancies and understanding the drivers behind the numbers is simplified through color-coded visuals, which spotlights areas of concern or success. Online tutorials are invaluable for users looking to elevate their skills in data visualization within spreadsheets, providing step-by-step guidance and best practices. They contribute significantly in harnessing the full potential of spreadsheets as an advanced analytical tool in both personal and professional realms.

Keywords
Excel Dashboard Setup, Interactive Budget Dashboard, Actual vs Budget Analysis, Performance Year Comparison, Excel Change Tracking, Excel Budget Visualization, Excel Actuals Reporting, Dashboard Change Indicators, Financial Analysis Excel, Budget Variance Dashboard