
Master DAX Functions: Enhance Your Data Visualizations
Discover Visual Calculations in Power BI: Simplify Your DAX Experience.
Key insights
- Visual calculations greatly simplify the process of creating and executing DAX calculations directly on visuals in Power BI, offering an easier way to manage DAX expressions.
- They provide a significant performance advantage by operating on aggregated data and being stored on the visual itself, freeing them from the complexities of filter context and model relationships.
- Users can enable visual calculations in Power BI Desktop through the Options menu under Preview features, expanding the possibilities for customized report generation.
- A variety of templates and functions specific to visual calculations are available, such as Running Sum and Moving Average, enhancing the utility and flexibility of report design.
- However, visual calculations come with limitations and considerations during their preview phase, including incompatibility with certain visual types and the temporary unavailability of some functionalities like personalization and reuse.
Exploring Visual Calculations in Power BI
Introduced as a preview feature, visual calculations represent a significant evolution in the way data professionals can interact with and manipulate data within Power BI reports. By focusing on calculations that are directly tied to the visual elements of a report, Microsoft introduces a method that not only simplifies the creation of complex expressions but also aims to improve overall performance. This closer integration between data manipulation and visualization offers an intuitive approach for users, making it easier to craft tailored reports without deep dives into DAX complexities.
By storing calculations at the visual level rather than within the model, visual calculations escape the burdens of traditional DAX calculation concerns such as filter context or detailed data modeling. This feature not only speeds up report performance but also opens the door to a more dynamic, on-the-fly analysis approach. Additionally, templates and specialized functions further streamline the report customization process, allowing for rapid adoption of common calculation types.
Yet, with these advantages come a slew of considerations and limitations. Currently, not all visuals support these types of calculations, and certain functionalities are absent. Despite these constraints, visual calculations in Power BI herald a promising shift towards more accessible, efficient, and user-friendly data analysis tools. As this feature evolves, it's expected to overcome its current limitations, further solidifying Power BI's position as a leading business intelligence platform.
Visual calculations represent a new feature in Power BI, allowing DAX calculations to be directly applied on visuals. This development simplifies creating previously complex calculations, leading to easier DAX maintenance and improved performance. An example provided is the running sum for Sales Amount, showcasing straightforward DAX requirement.
Visual calculations can reference data within the visual, such as columns and measures, removing the complexity associated with the semantic model. This feature facilitates common business calculations like running sums or moving averages. Unlike traditional calculations stored in the model, visual calculations are stored within the visual itself, providing a focused, simpler approach without the overhead of model complexities.
The integration into visuals means that these calculations can only refer to data presented within the visual, enhancing performance by operating on aggregated data rather than detailed records. Visual calculations offer a blend of simplicity and flexibility, comparing favorably against traditional measures in terms of performance.
To utilize visual calculations, users must enable this feature within Power BI's Options and Settings. The process involves adding a new calculation to a visual through the Power BI Desktop interface, promoting a user-friendly experience with a formula bar and visual matrix for immediate feedback.
Visual calculations accommodate the inclusion of most existing DAX functions and introduce several specific to visual calculations, enhancing flexibility. Functions such as RUNNINGSUM and MOVINGAVERAGE exemplify the tailored functions available, optimizing common calculation needs within visuals.
Templates for visual calculations expedite the creation of common calculations. With options for running sums, moving averages, and percentage calculations, these templates serve as a highly efficient starting point for custom expressions, streamlining the calculation process.
The functions AXIS and RESET, exclusive to visual calculations, offer advanced control over how calculations traverse through the data within visuals. These, paired with ORDERBY and PARTITIONBY, provide nuanced ways to manage data evaluation, allowing for a more customized analytical approach.
Despite the current preview status of visual calculations, certain limitations exist, such as compatibility issues with specific visual types and limitations in functionality within the Power BI service. Users are encouraged to consider these when incorporating visual calculations into reports.
The roadmap for visual calculations in Power BI includes replacing existing feedback mechanisms with a new system, indicating ongoing enhancements. As developments progress, users can look forward to more refined and robust calculation capabilities within their Power BI visuals.
People also ask
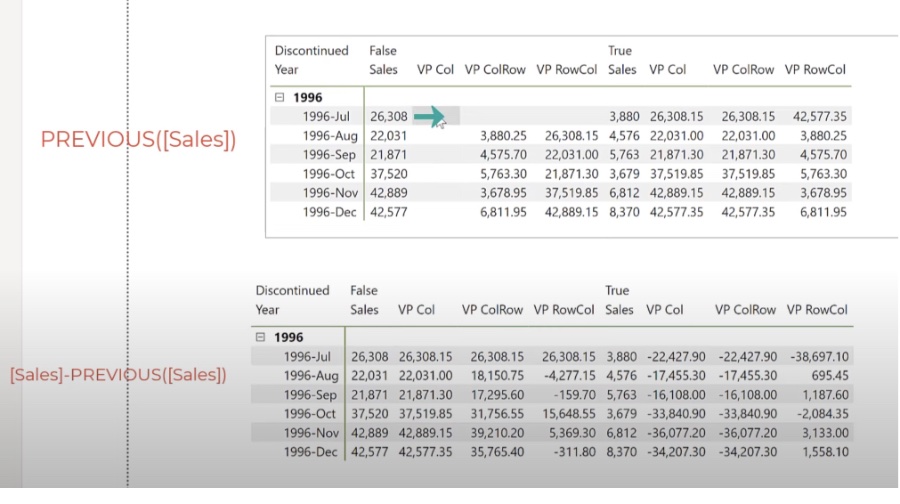
What are the previous functions in DAX?
Answer: "The Previous function in DAX allows for the retrieval of data from the directly preceding row within the axis of a Visual Calculation data grid. This functionality facilitates the examination of datasets in a sequential manner."Which DAX function is used to CALCULATE the previous year metric value?
Answer: "The DAX function designed for calculating the metric value of the preceding year is the PREVIOUSYEAR function. This function is extensively documented within the DAX section of Microsoft Learn."What is visual calculations?
Answer: "Visual calculations refer to the execution and definition of DAX calculations directly on a visual element. This approach streamlines the creation of calculations, which previously might have been cumbersome to implement. It simplifies the use of DAX, enhances maintainability, and optimizes performance."Which DAX function is used to change the filter context of an existing measure?
Answer: "To alter the filter context of an existing measure, the CALCULATE function is utilized. This powerful function allows users to pass filters and filter modifiers, facilitating context transition and enabling dynamic adjustments to data analysis criteria."
Keywords
PREVIOUS DAX Function, Visual Calculations DAX, DAX Function Tutorial, Power BI DAX Functions, Advanced DAX Calculations, DAX Time Series Analysis, Power BI Visual Calculations, Learning DAX