
Ult/Power BI Guide: Master Data Visualisation Easily
Microsoft MVP | Author | Speaker | Power BI & Excel Developer & Instructor | Power Query & XLOOKUP | Purpose: Making life easier for people & improving the quality of information for decision makers
Explore Beginner Power BI Tutorial: Visuals, Tips, Download Links & More
Key insights
- Introduction to Power BI Visualisations: A tutorial aimed at beginners to guide them in creating visuals in Power BI, highlighting the use of source files and demonstration files in the process.
- Comprehensive Learning Resources: Links to various playlists which include videos on SharePoint, OneDrive, DAX, and data models are provided to enhance learning.
- Design Tips for Effective Visuals: Emphasis on simplicity, consistent use of three colors, removal of clutter, and strategic use of lines and whitespace to organize visuals effectively.
- Structural Content: The tutorial outlines a structured plan beginning with an introduction and advancing through topics such as data extraction, report building, and specific visualization techniques like data bars and slicers.
- Additional Resources and Contact: Mention of a book titled "Power BI for the Excel Analyst" for deeper learning, along with contact information and a reference to the tutorial team’s broader services in Power BI and Excel.
Power BI for Beginners
This tutorial provides an accessible entry point for beginners to learn the basics of Power BI, a powerful business analytics tool. It not only teaches how to create visuals effectively but also how to utilize data from Excel to build informative reports. The tutorial also shares valuable design tips to make the visuals more effective and easier to understand, such as the use of consistent colors and the strategic organization of information.
Wyn Hopkins, an MVP for Microsoft, recently uploaded a valuable YouTube video that serves as a beginner’s tutorial on visualizing data using Power BI. In this tutorial, Hopkins provides clear guidance for novices to effectively create impressive visualizations. He emphasizes the importance of starting with straightforward designs and recommends various resources such as additional videos and free downloads to assist in the learning process.
In particular, Excel and Power BI demo files which can be downloaded to facilitate practical learning. He also provides links to specific playlists dedicated to SharePoint, OneDrive, and advanced DASX techniques, ensuring learners have access to diverse topics and in-depth materials. This approach not only introduces beginners to the basics but also acquaints them with further possibilities in data handling and visualization succinctly.
Additionally, Hopkins outlines essential best practices in design such as maintaining simplicity, using a consistent color scheme, and organizing visual elements effectively to enhance clarity. The video also covers a variety of topics including the use of Power Query for data extraction, building comprehensive reports, and implementing advanced features like slicers and custom interactions. These insights are backed by examples that demonstrate how to bring data to life.
Another crucial part of the tutorial includes a series of general tips for effective data visualization. These include keeping designs uncluttered, using whitespace effectively, and avoiding overly complex visual elements such as pie charts. Hopkins stresses the importance of contextualizing data, using tools like prior year comparisons, and making interactive reports for better user experiences.
Throughout the video, Hopkins systematically breaks down the timeline, outlining what viewers can expect at each stage of the tutorial. From basic settings adjustments to sophisticated data manipulation techniques, the structure provided ensures that learners can follow along without confusion. This step-by-step guidance is ideal for beginners who are keen on diving into the world of data visualization with Power BI.
The educational content is complemented by references to Hopkins’ own professional experiences and achievements, including his work with Access Analytic and his publication of “Power BI for the Excel Analyst”. This lends additional credibility to the tutorial while also providing viewers with opportunities to explore further learning through books and professional services.

People also ask
How do you create simple visualization in Power BI?
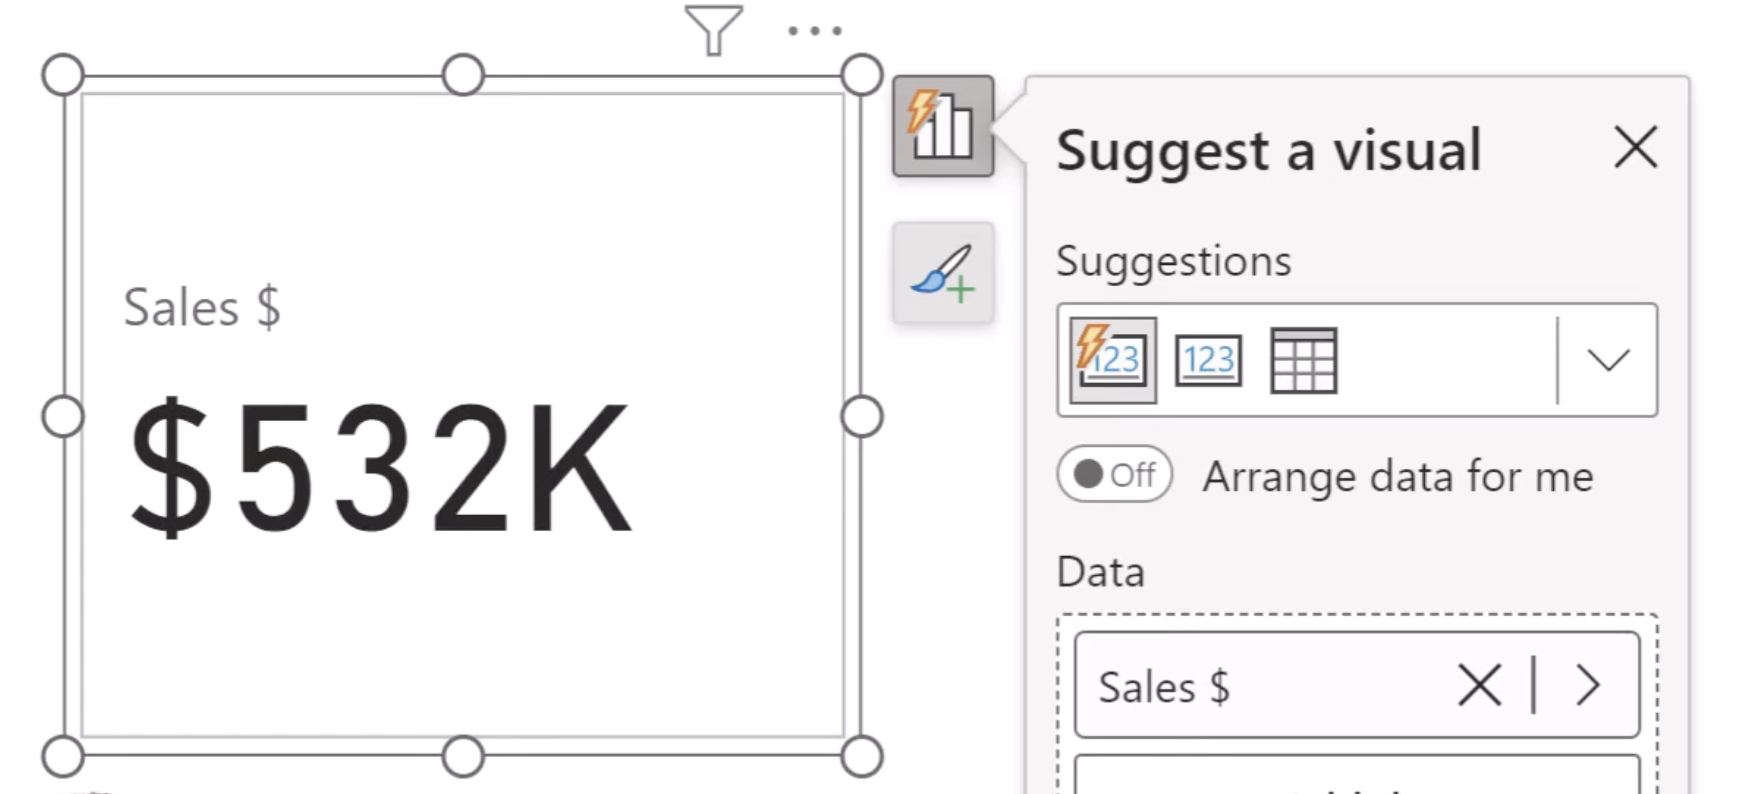
To create a visualization in Power BI, start by selecting a field from the Data pane. Power BI will automatically suggest a visualization type based on the field selected. If desired, you can switch to a different visualization type by choosing an alternative icon from the Visualizations pane.
Is Power BI beginner friendly?
Power BI is particularly geared towards beginners, providing a user-friendly interface that combines simple usability with advanced data analytics capabilities.
How do I learn Power BI for beginners?
In this article
Can I use Power BI for data visualization?
Power BI is adept at catering to diverse user needs, merging accessibility with customization. It enables the creation of highly tailored dashboards and visualizations to meet the varied data visualization requirements within any organization.
Keywords
Power BI tutorial, Power BI beginners guide, data visualization tutorial, Power BI visualization, learn Power BI, beginner BI course, Power BI training, Power BI dashboard tutorial