Excel inventory tracker: calculate stock and flag reorders
Co-Founder at Career Principles | Microsoft MVP
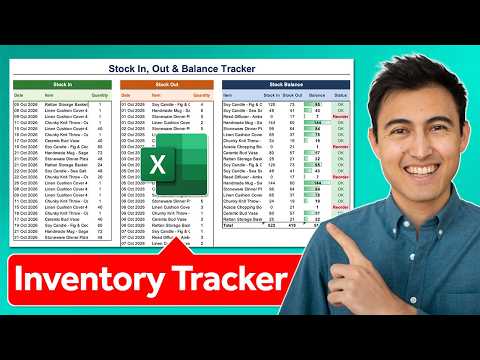
Build an Excel tracker that calculates stock balances from purchases and sales and flags items at or below their reorder level.
Key insights
- Calculate each balance as opening stock plus stock in minus stock out.
- Use data-validation drop-downs to keep transaction item names consistent with the inventory list.
- SUMIFS totals incoming and outgoing quantities for each item.
- An IF formula marks items for reorder when the balance is at or below the reorder level.
- Excel tables extend formulas and drop-down behavior when users add rows.
Excel can calculate inventory balances from stock-in and stock-out records, flag items at or below a reorder threshold, and summarize the results on a dashboard. The approach suits small businesses and individual Excel users who need a structured tracker; the source does not specify a required license or plan. Kenji Farré (Kenji Explains) [MVP] demonstrates how to assemble this workbook in Excel.
What it does
The tracker separates a product list and its current stock calculations from records of incoming and outgoing quantities. For each item, the balance is opening stock plus total stock in minus total stock out. This means a user records movements in the transaction areas instead of manually recalculating the balance each time.
A reorder level is an editable minimum chosen for each item. An IF formula compares the calculated balance with that level and returns a status: “Reorder” when the balance is less than or equal to the threshold, or “OK” otherwise. Conditional formatting colors those statuses, while data bars make the relative size of balances easier to scan.
A separate dashboard summarizes item counts, items to reorder, units in stock, units received, and units sold. It also includes a chart comparing balances with reorder levels and a bar chart intended to show best-selling items. The workbook’s linked formulas and tables are meant to keep these figures aligned with changes to the source data.
Who it is for and what you need
This design is for people who can create and maintain an Excel workbook and want a straightforward way to track stock movements. It may be useful when the item list and transaction records are small enough to manage in the workbook. The demonstration uses sample products and quantities rather than an industry-specific inventory system.
The source does not state an Excel license, subscription, operating system, or rollout requirement. It also does not establish whether the example has been tested in Excel for the web or with multiple users editing at once. The demonstrated controls include the Data tab’s Data Validation command, Excel tables created with Ctrl+T, formulas, conditional formatting, and charts.
Before using the workbook for purchasing decisions, decide what counts as an incoming or outgoing movement and set a suitable reorder level for every item. The example records stock in and stock out separately, with a date, item, and quantity in each movement area. Its sample does not describe tracking suppliers, costs, locations, returns, or transfers.
How it works
- Set up the inventory list. Add each item, its opening stock, a reorder level, and columns for stock in, stock out, balance, and status. Opening stock can be zero when no units are on hand.
- Create stock movement areas. Make separate stock-in and stock-out lists with date, item, and quantity columns. Apply Data Validation from the Data tab to the item cells and use a list based on the inventory items. This helps prevent a differently spelled item name from being left out of the totals.
- Convert the movement ranges to tables. Select each data range without its title row and press Ctrl+T. The demonstration notes that tables can carry drop-downs and formulas into added rows.
- Total movement by item. Use SUMIFS to sum the quantity column for stock-in records matching the item in the inventory list. Repeat for stock-out records. The criteria range is the item column, and the criterion is the current item.
- Calculate balance and status. Add opening stock to stock in and subtract stock out. Then use an IF test to return “Reorder” if the balance is less than or equal to the reorder level, and “OK” if it is higher.
- Make exceptions visible. Apply data bars to the balance cells. Add conditional-formatting rules to show “Reorder” in red and “OK” in green. The example also converts the inventory range to a table and uses its total row for sums.
- Build a dashboard. Use COUNTIF to count reorder statuses and COUNTA to count item names. Link stock totals to the inventory calculations. Insert a combo chart for balance and reorder level, then a bar chart based on item and stock-out data for best sellers.
The dashboard charts and summary cells are linked to the workbook’s underlying data. The demonstration tests edits to existing records and adding a row, and shows the calculated figures changing. That behavior depends on setting up the tables and formulas correctly.
Limitations and open questions
This is a basic tracker, not a complete inventory-management specification. The demonstrated structure does not include unique product IDs, inventory value, supplier details, locations, or a log of transaction types beyond stock in and stock out. Add those only if the workflow requires them, and adapt the calculations carefully.
The example’s stock-out quantities stand in for sales when it identifies best sellers. That assumption may not fit a business where stock can leave for reasons other than sales. The source does not explain controls for duplicate records, negative quantities, corrections, returns, simultaneous edits, or auditing changes.
The video demonstrates the formulas and workbook setup but does not verify licensing, web-versus-desktop feature differences, or suitability for large inventories. Treat reorder thresholds as assumptions to maintain, not automatic purchasing instructions. For more Excel guidance, see the HubSite 365 topic page.
Sources
Frequently asked questions
How do I calculate stock balance in Excel?
Add opening stock to the total incoming quantity and subtract the total outgoing quantity. The example uses SUMIFS to total movements by item.
How can Excel flag items that need reordering?
Compare the balance with the reorder level using IF. Return “Reorder” when the balance is less than or equal to the threshold, then use conditional formatting to highlight that status.
How do I keep item names consistent in an Excel inventory tracker?
Use Data Validation with a list based on the inventory items. The example applies this to the item cells in the stock-in and stock-out records.
Does this Excel inventory tracker require a particular license?
The source does not state a required Excel license or plan.