Excel
Aug 30, 2026 5:17 PM
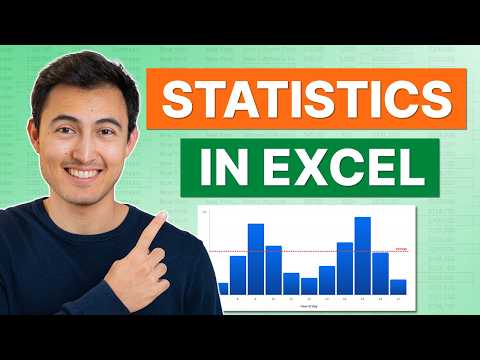
Excel Statistics in 14 Minutes
by HubSite 365 about Kenji Farré (Kenji Explains) [MVP]
Co-Founder at Career Principles | Microsoft MVP
Microsoft Excel stats: descriptive to inferential analysis, t test ANOVA, histograms, correlation with Power BI
Key insights
- Video overview: A 14-minute tutorial uses a fictitious salary dataset to teach core statistical steps.
It covers Descriptive Statistics, Distribution analysis, Inferential Statistics, and Correlation in a compact, practical workflow. - Descriptive statistics workflow: Enable the Analysis ToolPak and run the Data Analysis tools to get averages and spread.
Key outputs include the mean, median, standard deviation, minimum, maximum, and quartiles. - Distribution and visualization: Use measures like skewness and charts such as the histogram and box-and-whisker to compare groups.
This helps reveal variation across departments and highlight outliers. - Inferential statistics: Apply a t-test to compare remote vs non-remote salaries and use ANOVA to test differences across education levels.
Interpret results with p-value and check basic assumptions like normality and equal variances. - Correlation and interpretation: The tutorial shows years of experience and age have a positive relationship with salary.
Remember correlation does not prove causation; use further analysis before inferring cause. - Modern Excel tools: Excel now offers Analyze Data (replacing Ideas) for plain-language summaries and visual suggestions.
Copilot can help generate formulas and insights while the classic Analysis ToolPak remains useful for standard statistical output.

Keywords
learn statistics in excel, excel statistics tutorial, quick statistics excel 14 minutes, excel statistical analysis, excel data analysis statistics, excel statistical functions, statistics for beginners excel, learn excel statistics fast
HubSite 365 Apps