
Enable Dev Toolbar in New MS Teams - Quick Guide
Microsoft MVPs, YouTube Creator youtube.com/giulianodeluca, International Speaker, Technical Architect
Unlock Dev Toolbar in Microsoft Teams for App Integration Monitoring & Troubleshooting Tips!
Discover how to activate the Developer Toolbar in the new Microsoft Teams client, especially if you are working on creating or integrating apps and services within Teams. This advice can be incredibly helpful for monitoring and troubleshooting any issues. Understanding how to enable and access this tool is essential for developers working in Teams.
The video's timeline helps viewers navigate the content easily:
- 00:00 - Introduction to the topic
- 00:49 - Steps to enable the Developer Tools in Teams
- 03:44 - Instructions on opening the Developer Toolbar
- 05:17 - Wrap-up and final thoughts
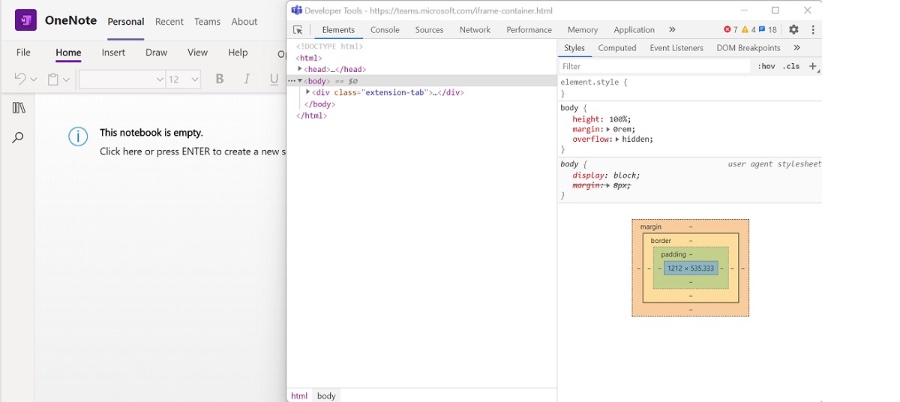
When using Teams in a browser, accessing the built-in development tools is straightforward. For Windows, pressing F12 or using combination keys on MacOS opens these investigative tools. These tools are beneficial for monitoring console logs, adjusting HTML/CSS on the fly, and reviewing network requests in real time. Moreover, developers can set breakpoints in JavaScript for detailed debugging sessions.
A critical note is that these features are only accessible on the desktop and Android clients after the "Developer Preview" is enabled. This provides the necessary permissions and access for Developers to utilize these advanced troubleshooting features. Enabling these tools on the desktop client involves activating the Developer Preview and opening a tab for inspection.
For Windows users, the Developer Tools can be accessed through the Microsoft Teams icon situated in the desktop tray. MacOS users can find the equivalent option by selecting the Microsoft Teams icon on the Dock. These steps provide a gateway into the coding underpinnings of Teams, offering insights into tab configurations and operational mechanics.
Additionally, the Developer Tools can be activated on an Android device. After enabling Developer Preview, developers can connect the Android device to a desktop computer for remote debugging. Using Google Chrome, accessing the 'chrome://inspect/#devices' URL will present an option to inspect the developer aspects of the tabs in use.
General Information About Developer Tools in Microsoft Teams
The Developer Toolbar in Microsoft Teams is a potent feature allowing developers to seamlessly integrate and create applications within the Teams environment. By utilizing this toolbar, developers can troubleshoot errors, inspect elements, and debug applications effectively within Teams. It serves as a bridge between the ease of a web client and the complexity of a desktop environment, delivering versatility whether you’re working on Windows, MacOS, or an Android platform. Giving developers the power to inspect and interact with the code at the backend enhances the potential for customization and innovation in developing Teams apps.

Learn about How to enable the Dev Toolbar in the new Microsoft Teams client
Enabling Developer Tools in Microsoft Teams
For those who are involved in creating or integrating applications and services into Microsoft Teams, understanding how to monitor and troubleshoot is essential. Enabling the Developer Tools within the Teams client can be a great asset for this purpose. This feature is especially useful within Teams to keep track of various aspects of the apps and services being developed.
Microsoft Teams provides timestamps in their videos to guide users through the process of enabling and using the Developer Tools. This structure helps users to navigate directly to the information they need. Starting off, the video shows an introduction, followed by a guide to enable the tool and finally, it wraps up with a conclusion.
To access Developer Tools on the desktop version of Microsoft Teams, a different process is involved when compared to the Teams web version. Desktop users must activate the Developer Preview mode and open a tab for inspection purposes. Developer Tools can be accessed in multiple ways depending on the operating system used, such as via the desktop tray icon on Windows or the dock icon on MacOS.
Instructions for Enabling Developer Tools on Desktop and Android
Utilizing the Developer Tools on a Windows or MacOS desktop involves several steps. The user must have the Developer Preview enabled to properly inspect elements with the Developer Tools. It's also important to open a specific tab within Microsoft Teams to begin an inspection session effectively.
For Android devices, a similar process is needed to access the Developer Tools. This includes turning on the developer preview, connecting your Android device to a desktop computer for remote debugging, and using your Chrome browser to select the Teams tab you wish to debug. It should be noted that the Developer Tools feature is available only for desktop and Android clients after enabling the Developer Preview.
The ease of access to Developer Tools when using Teams in a browser is worth mentioning. For example, on a Windows machine, the DevTools can be brought up by pressing F12, or Command-Option-I on MacOS. These tools are powerful as they allow users to view console logs, modify runtime HTML, CSS, and network requests, as well as add breakpoints to JavaScript code for deeper debugging.
- Enabling Developer Preview on desktop and Android for access
- Inspecting console logs, modifying HTML/CSS, and debugging JavaScript
- Access methods vary across Windows, MacOS, and Android platforms
Understanding Developer Tools Availability
In summary, enabling and using Developer Tools in Microsoft Teams is crucial for developers and IT professionals who build and integrate applications. It facilitates the process of monitoring and troubleshooting by providing vital inspection capabilities. For the desktop audience, it requires activating Developer Preview, while Android users need to set up their devices for remote debugging. The accessibility of these tools brings an advantage to users, giving them the ability to view and manipulate different elements of their apps and services in real-time.
Expanded Overview of Developer Tools in Microsoft Teams
Developer Tools are instrumental for anyone looking to develop or enhance applications within Microsoft Teams. These tools allow professionals to effectively inspect elements, troubleshoot issues, and validate code changes in real-time, ensuring that the integrated apps operate smoothly within the Teams environment. The ability to access these tools directly from desktop or Android devices after activating the Developer Preview makes the development process more intuitive and responsive to the needs of developers.
More links on about How to enable the Dev Toolbar in the new Microsoft Teams client
- DevTools for Microsoft Teams tabs
- Jul 31, 2023 — You can also enable the DevTools from the Teams Android client. To enable DevTools, you must: ... Select inspect under the tab you wish to debug, ...
- How to enable the Dev Toolbar in the new Microsoft Teams ...
- 23 hours ago — How to enable the Dev Toolbar in the new Microsoft Teams client. If you are creating or integrating Apps & Services in Teams you may find this ...
Keywords
Microsoft Teams Dev Toolbar Enable, Enable Developer Toolbar Teams, New Teams Client Developer Mode, Activate Teams Development Tools, Teams Client Dev Tools Access, Access Dev Toolbar Microsoft Teams, Microsoft Teams New Client Features, Developer Options Microsoft Teams, Microsoft Teams Client Toolbar Enablement, Microsoft Teams Developer Console Enable