
Creating Custom Power BI Visual with Deneb
Microsoft MVP | Author | Speaker | Power BI & Excel Developer & Instructor | Power Query & XLOOKUP | Purpose: Making life easier for people & improving the quality of information for decision makers
Unlock advanced visualizations in Power BI with Deneb. Learn to create bespoke data visuals in our guide for Microsoft experts.
Creating Personalized Visuals with Deneb in Power BI
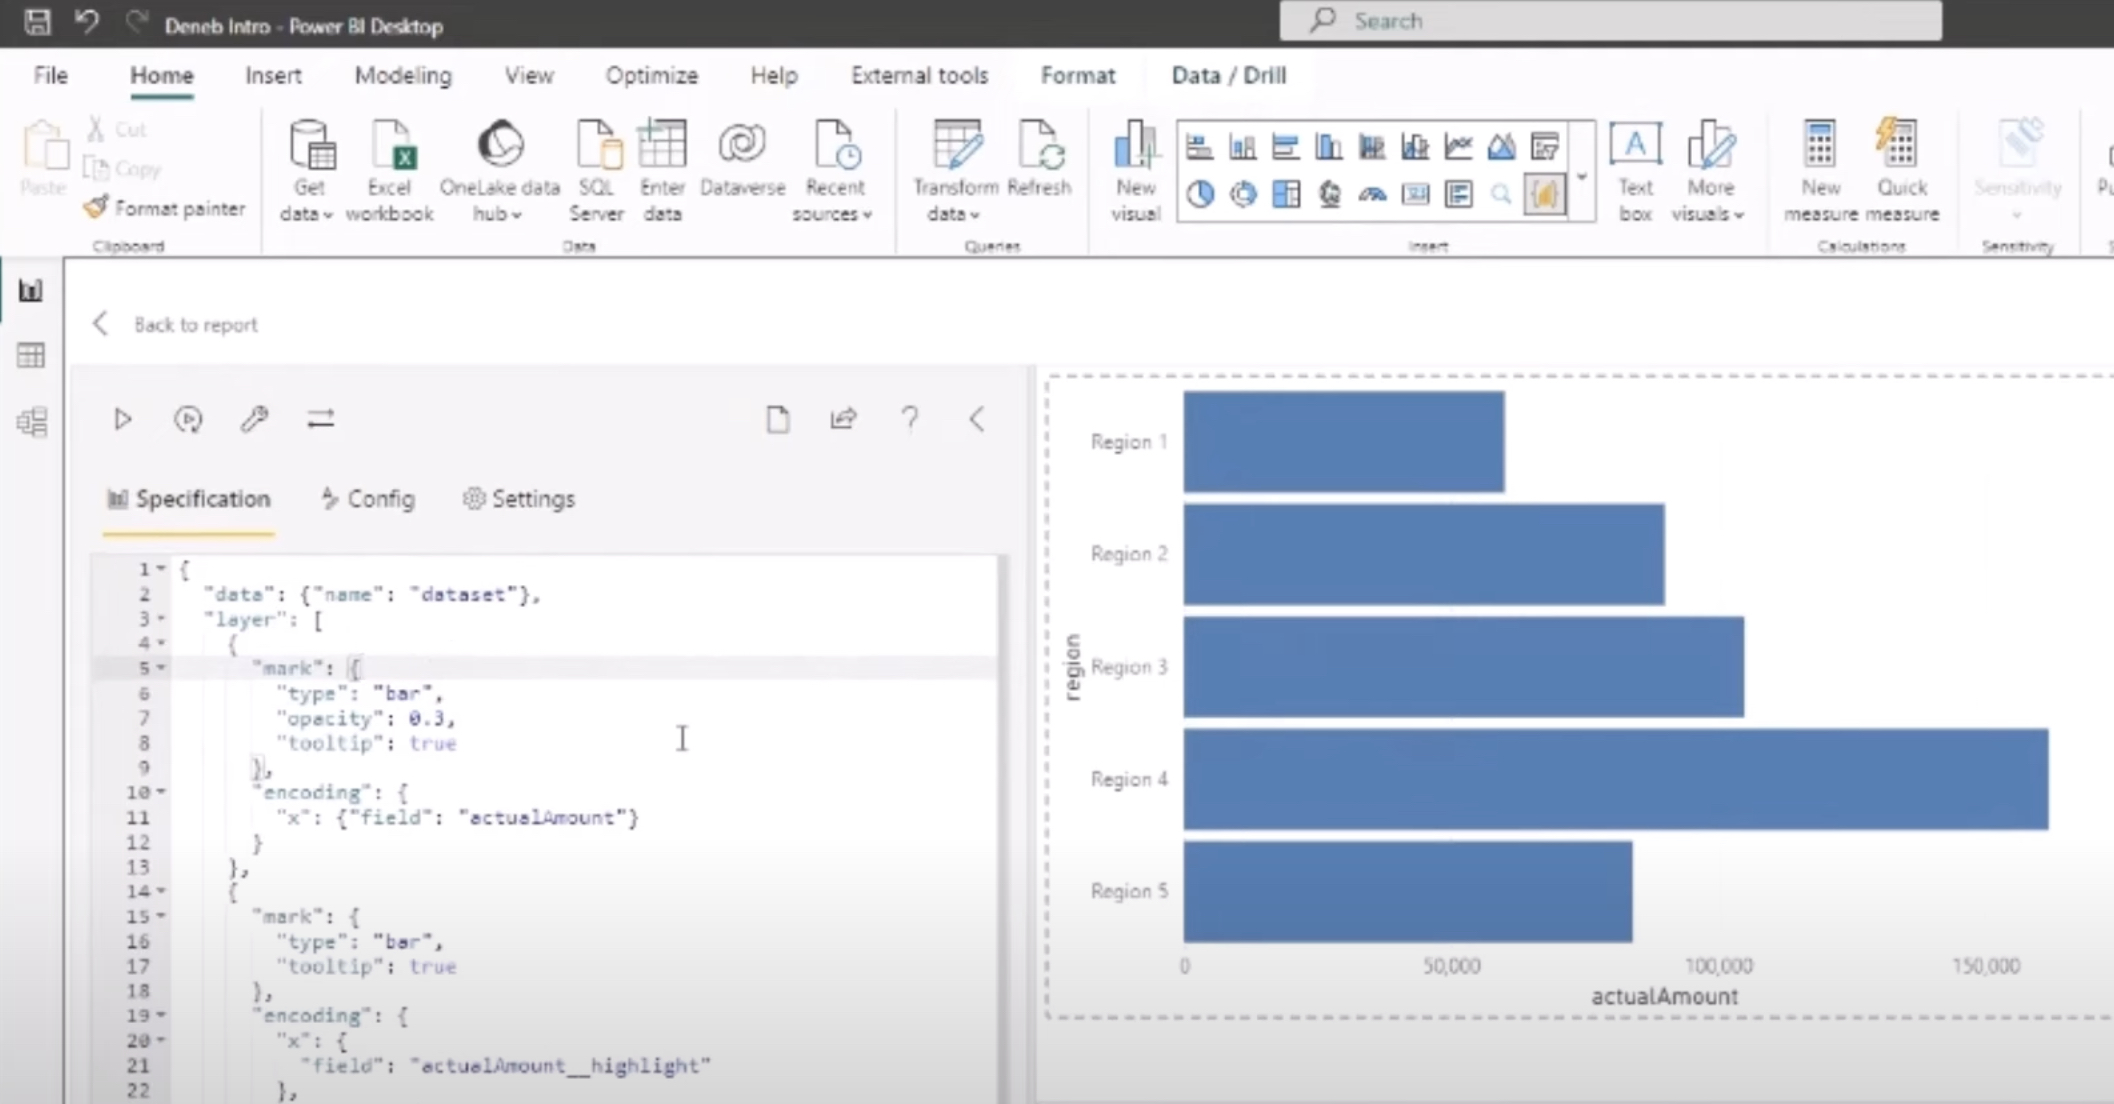
Deneb is a versatile application that enables users to craft unique visualization tools within the Power BI environment. This YouTube video by Wyn Hopkins walks through the process of developing a basic visual using Deneb, providing an introduction and comprehensive guide to this impressive tool.
This guide reveals how you can convert the declarative JSON syntax of Vega or Vega-Lite languages into your own tailored data visualizations without requiring knowledge of web development. This approach is akin to methods for creating R and Python visuals within our data analytics tool.
Resources:
Deneb's benefits include no dependencies on local libraries or gateways for users when publishing reports. Visuals will display in any client environment of our data analytics tool. Specifications are rendered directly within the application rather than delegated to another location, often resulting in swifter render times for the end-users.
Furthermore, Deneb is made for the web, inferring it's possible to integrate with our data analytics tool's interactive features after some supplementary setup. Learning the Vega-Lite and Vega languages as well as mastering the capacity to 'think visually' can vastly enhance your visual options. For detailed information regarding development and usage of Deneb visuals, visit here.
Anecdotal evidence of Deneb's effectiveness is shared through a LinkedIn post by the author that gained notable attention. This led to requests for a guide on how to utilize Deneb, culminating in the creation of the discussed video guide. The tutorial demonstrates the reconstruction of an interactive view of Seattle's weather, created by @jakevdp, including variables like maximum temperature and the number of sunny, rainy, foggy, or snowy days.
Deneb is a tool created by Daniel Marsh-Patrick that's based on Vega and Vega-Lite language for interactive graphics. This custom visual allows you to craft visuals within our data analytics tool that can resemble any design you envision. The potentials it offers are limitless.
Both Vega and Vega-Lite are languages used to describe interactive data visualization. Vega is a more intricate language that offers extended customization options, while Vega-Lite is a high-level syntax based on Vega, providing a simple way to create and share potent visualizations.
Before starting with Deneb and our data analytics tool, you first need to install the custom visual directly from the platform. Developed by MVP Daniel Marsh-Patrick, Deneb provides a declarative grammar approach via JSON syntax in the application. This challenge is more focused on exposure to a potentially valuable new tool rather than attempting to work through a complex solution.
While Charticular is User Interface-driven, Deneb is text-driven. It may not be compatible for everyone, but if you've been longing for more customizable options in our data analytics tool, it's worth examining how Deneb might fit into your toolbelt.
Using Deneb
Deneb is not just a feature of our data analytics tool. It ultimately represents an innovative and customizable approach to data representation. By providing users a non-technical means to create complex and detailed visuals using Vega or Vega-Lite languages, Deneb has made it possible for anyone engaging with data to transform raw numbers into beautiful and meaningful visual stories. With a simple, user-friendly, and powerful platform, Deneb amplifies the capabilities of our data analytics tool, making it an indispensable tool for data analysts.

Learn about How to create your own Power BI visual using Deneb
To widen your understanding on generating personalized visuals on Power BI using Deneb, one must internalize what Deneb is and how to construct a basic visual. Broaden your understanding by exploring various resources like vega.github.io, kerrykolosko.com, or Microsoft's public platforms.
Deneb is a uniquely developed visual for Power BI, allowing users to use Vega or Vega Lite languages' declarative JSON syntax to build custom data visualizations without the need for web development knowledge. This methodology resonates with creating R and Python visuals within Power BI with some added advantages:
- No additional dependencies for end-users when publishing reports on local libraries or gateways
- Faster render times due to in-app specifications rendering
- Made for the web, offering the possibility to integrate with Power BI's interactive features with some additional setup
By thoroughly understanding the Vega-Lite and Vega languages, and learning to "think visually", you will find an increased quantity of visual options within this BI tool. Visit https://deneb-viz.github.io to get started and cover PBI-specific aspects including visual canvas integration capabilities such as tooltips, context menus and cross-filtering other visuals.
Deneb's popularity became evident with a LinkedIn post referencing it gaining traction. It's clear there is a demand for knowledge about its application hence the decision to compose a comprehensive guide for novice users. It is a quick guide outlining how to get started, hovering over the learning path, and citing useful resources.
Deneb was birthed from the innovative mind of Daniel marsh-Patrick. Based on the Vega and Vega-Lite language for interactive graphics, Deneb allows creation of highly customizable visuals. It expands the range of possibilities for interactive visuals making it an essential tool.
Declarative Visualization in Power BI, Vega and Vega-Lite are languages used to describe interactive data visualizations. While Vega offers more options for customizing your visualizations albeit with a bit of complexity, Vega-Lite on the other hand offers a more concise way to create and share powerful graphics.
When starting with Deneb, first install the custom visual directly from this BI tool. Being currently on public preview, it would hopefully soon be available in AppSource. Deneb, like the Charticulator challenge, is more about exposure to another valuable tool than attempting to wrestle through a tedious solution. Despite being text-written, it offers more customizable options, see how it can fit in your tool log.
More links on about How to create your own Power BI visual using Deneb
- Declarative Visualization in Power BI | Deneb
- Deneb is a certified custom visual for Microsoft Power BI, which allows developers to use the declarative JSON syntax of the Vega or Vega-Lite languages to ...
Keywords
Power BI visual creation, Deneb tutorial, Deneb Power BI, create Power BI visuals, Power BI Deneb guide, make Power BI visual with Deneb, Deneb visual instructions, DIY Power BI visual, Building Power BI Deneb visual, Learning Deneb Power BI.