
Integrate Power App with Power BI Reports: Step-By-Step Guide
Microsoft MVP | MCT | Power Platform Evangelist | LinkedIn Learning Instructor
Boost interactivity in Power BI reports by embedding Power Apps - heres how to do it, from adding visuals to customizing screens.
The blog post by Rishona Elijah [MVP] enlightens users on how to embed a canvas app in Power BI reports using Microsoft's suite. Here, the Power Apps (1/3) visual comes into play, which enhances the users' interaction with the BI report page. A step-by-step guide is provided on integrating the Power Apps visual in the report, creating a new app based on the report data, furnishing app screens with extra data, and finally experiencing it in the report.
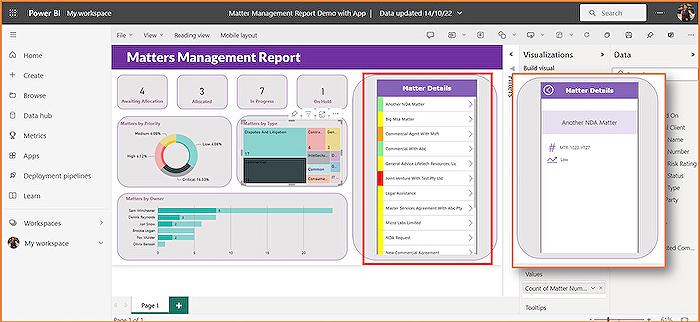
Like any Power BI report, the starting point is either the Power BI Service or Desktop. The Power Apps (2/3) visual is then clicked and stationed on the report page. The writer cites an illustration stating the purpose of the report is to enunciate information about contracts/matters. It elucidates interactive filters that allow specifics based on contract/matter owner, type, importance, and other factors. The integrated app should present a list of matters and their names with further details popping up when one clicks on a matter.
To proceed further, fields that will be used in the app need to be selected. Users should then mark the checkbox adjacent to the fields they seek to get into the app. They are also guided to select the correct environment within the visual before moving forward. Creating a new app, the selected fields appear on the app screen.
The customizations aboard entail changing the field visible, and modifying the screen design. In an instance illustrated, an added rectangle in the gallery displays a colour depending on the value of Matter Risk Rating. Sections are added to the screen with detailed info and text labels to echo relevant data. Just for an example, to display the Matter Name in a text label, a formula is applied on the Text property.
Further, a button is placed for the users to get back to the first screen. Back arrow or button should have an OnSelect property. Back on the first screen, a formula needs to be added to navigate to the next page principal for the arrow. Once the app is operational in Power BI, it needs to be saved.
It is imperative to publish and share the app for others to interact with it. Back on the Power BI report, users should see the app they created. It should be saved and then tested by clicking the report filters. Doing this will modify the records visible in the app's list. Lastly, for greater understanding details on integration, visit this link.
Further Insights
In this digital age, Microsoft Power Apps (3/3) and Power BI tools are advantageous for businesses in numerous ways. They prove to be a great help in the integration of business apps directly into the BI report page, providing an interactive user interface. Such an integration gives a boost to user tasks, offering them with a detailed analysis of their data. By creating screens with additional information within a Power BI report, users can have an in-depth view and understanding of their data.
Read the full article Embed a Power App in your Power BI reports
Learn about Embed a Power App in your Power BI reports
Today, we're going to delve into how you can boost the interactivity of your Power BI reports by integrating a canvas application directly on a Power BI report page, using the Power Apps visual. This powerful combination gives you a more dynamic and interactive way of showcasing data in your reports. You can include additional detailed screens within your application, further enhancing the information depth available to your report users.
Before we move forward, ensure that you have your report ready in Power BI, which can be either on Power BI Service or Desktop. Afterwards, locate and select the Power Apps visual and position it on your report page. This gives you the platform foundation to start adding interactive layers to your report.
Why are you doing all these? Well, the benefit of embedding an app in your report is its ability to provide rich and interactive filters. This means users can easily sift through intricate data based on certain variables such as contract owner, type, priority, and more. For instance, with an embedded application, your users can view a comprehensive list of matters by their names, and by clicking on each matter, fetch additional information on it.
Next, you need to select the relevant fields to use in your application. Here, ensure your required environment is selected within the visual. Once the fields are chosen, based on which you want to convey data through your application, click on 'Create new'. These steps will lead you to canvas application in a new tab with a screen containing your chosen fields.
In case you want to make any changes like altering which field should be visible, you can simply click on the relevant field from the gallery and replace it. In this canvas application, you are free to customize the screen designs as per your liking.
For a more granular display of data, you can create a screen showcasing additional details. Secondary display screens can be embedded with Text Labels that show more specific information. This way, you can showcase more intricate contract details directly on the report.
Lastly, it's always helpful to integrate navigation options like a back button for users to return to the main screen. Also, add a forward navigation tool leading users to the next page. Once your app is set and ready for use in your Power BI report, ensure to save the application. Additionally, publish and share the app for other users to interact with it.
This interactive setup of applications inside your reports not only makes your Power BI reports more attractive and engaging but also makes it simpler and more effective for users to extract insights. In conclusion, integrating a canvas application in a Power BI report is a robust method for making your communication of data an interactive, comprehensive, and efficient function.
More links on about Embed a Power App in your Power BI reports
- Tutorial: Embed a Power Apps visual in a Power BI report
- Jun 29, 2022 — Create a new app · Open the Opportunity Analysis sample report and select the Upcoming Opportunities page. · Move and resize some of the report ...
- How to create a canvas app with Power BI visual
- Dec 15, 2022 — Canvas apps created using Power Apps can be embedded in a Power BI report. Similarly, a Power BI report tile can be added to a canvas app. The ...
Keywords
Embed Power App, Power BI reports, Power App in Power BI, Power BI integration, BI reports Power App, Embedding Power Apps, Power BI Power App usage, Power Apps in BI reports, Power BI and Power App, Power App BI report embedding.