
Effective Design Strategies for Diverse Audiences
Master the art of designing Power BI dashboards for diverse target audiences with our Microsoft experts insightful guide.
Distilling Core Information from Diverse Data: A Blueprint
The challenges entailed in designing a dashboard for a multiplicity of target audiences can be quite intense. The ideal dashboard should display information that is actionable, informative, and visually pleasing. While a section of users may require highly detailed data, presented in varied dimensions along with options to filter and drill through, others may just need key metrics.
In addition, users' information processing proficiency may vary. Some might prefer a storyline guiding them through a dashboard filled with visuals and minimal detailed data, while others may find a structured and comprehensive data display more useful.
In terms of solution, a one-size-fits-all approach may be counterproductive. Cramming all information into a single dashboard may confuse users and hinder smooth user experience, leading to less use as it is difficult to locate critical information.
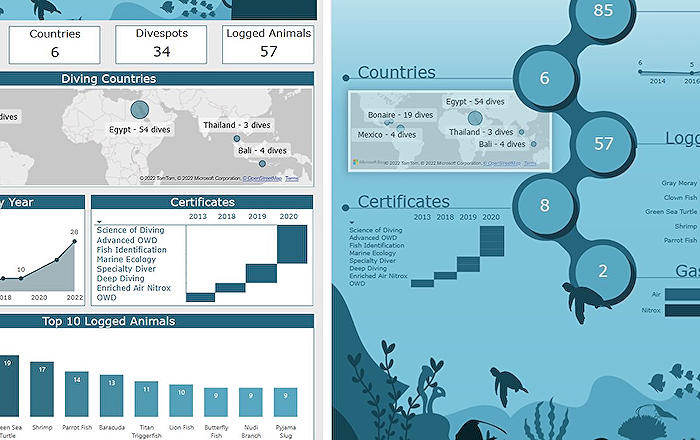
Instead, adopting a diverse approach might be more beneficial. You can build different dashboards (or pages) to serve the varied needs of your audiences. For instance, one dashboard style might work for users who wish to delve into data and use filters, while the other style, designed as an infographic, can be easily printed or hosted on a website for the users who only need straightforward information.
Understanding the audience and their specific needs is paramount. Start a dialogue with your audience, ask them about their use of the dashboard, the information they require, and their level of tech-savviness.
Consider whether your audience is already familiar with data and dashboards. Some users may not interact with data or Power BI dashboards daily. Hence, functions that might seem straightforward for more experienced users can pose challenges for others.
A key pointer is to understand what information these users are seeking and design the dashboard accordingly. Not everyone might need to see all the available data.
The amount of time a user plans to spend with the dashboard is also a consideration. For example, users who only need a quick glance at the most significant data can be provided with a dashboard designed for this specific need, avoiding unnecessary intricate details.
If the target audience prefers being detail-oriented and spends considerable time analyzing data, avoid using ambiguous visuals. This group may need in-depth data with clear cut numbers.
It is also important to question what the target audience actually needs. Oftentimes people try to squeeze in every bit of available information into a dashboard, fearing that a data point might be needed later. But, this might make the dashboard cluttered and directionless. If it's not adding value for the audience, it's better to leave it out.
Honing in on user-centric design processes can result in better dashboards that are easy to use and comprehend. The final dashboard might cater to different users in the same target audience, displaying the same data in varied ways.
For more in-depth details on this topic, visit this link
A multi-faceted data dashboard caters to diverse user needs by providing an array of data dimensions. The design process should prioritize user feedback, to create visually engaging and easy-to-navigate dashboards. While the data presented may have deep underlying complexities, they should be presented in a way that enables users to extract value easily. Thus, the cardinal rule: Design for your audience evolving needs.
Read the full article Designing for different audiences
Learn about Designing for different audiences
Creating visually appealing, informative and actionable dashboards for different target groups is no easy task. Understanding the audience and their needs is key. A one-size-fits-all approach is less likely to serve everyone's requirements, hence precision and consideration are necessary.
Various users require varying levels of information. Some may require exhaustive data with filtering and drilling capabilities, others may just require key metrics at a glance. User interaction with the dashboard also varies from simply clicking to extracting print views or checking their phones for relevant insights.
It is essential to acknowledge that information processing varies among users. While some prefer guided narratives with much visualization and minor detailed data, others may require a comprehensive and structured view of the data.
- Power BI allows you to create dashboards and infographics for different audience types.
When faced with a diverse audience, avoid cramming all information into one dashboard as it rarely improves user experience. Instead, cause confusion and frustration. Provide different dashboards (or pages) to cater to your audience's distinct needs.
Talking to your audience can prove useful in understanding their requirements and how they interact with the dashboard. Questions on their information needs, usage of the dashboard, and their tech-savviness can win you beneficial insights.
Not everyone is old hat with data and dashboards. Some users may find it challenging to handle features that may seem simple to you, including filters, bookmarks, and drill-through. Catering to their need might require you to design precisely for their demands.
- Infographics work best for users seeking quick data glance. They are ideal for users who want to see key numbers quickly, such as during meetings.
- Dashboards are ideal for users who interact more with data and might require additional analysis. They want to know and interact with the data. Infographics might come off as too simplistic for them.
Understanding how much time the user intends to spend with the dashboard is crucial. Some may require a quick look at the most meaningful data, while others may want to dig deep into the details. Tailor the dashboard to fit their needs.
Lastly, avoid overloading the dashboard with unnecessary information. While the data may become important later, including it unnecessarily can make the dashboard cluttered and lose focus. If it doesn't add value for your audience, it's best not to include it.
- Putting the user at the core of the design process can assist you in achieving user-friendly and comprehendible dashboards.
More links on about Designing for different audiences
- How to Successfully Design for a Target Audience
- Feb 10, 2023 — 1. Identify Your Target Audience · 2. Create Buyer Personas · 3. Check Out the Competition · 4. Put Aside Personal Preferences · 5. Use Typography ...
- 25. Designing For Your Audience II
- 3. Create your designs – informed by steps 1 & 2 · Highly visual · Clear and concise messaging · Storytelling messaging from real people (authenticity) · Call to ...
- 6 Tips To Successfully Design For Your Target Audience
- Sep 21, 2021 — Designing for a specific audience means you narrow down your options in every aspect of the design – color, font, font style, design style, ...
Keywords
Designing for different audiences, Audience-centric design, UX design, UI design, User experience, Understanding audiences, Designing for demographics, Designing for diverse audiences, Audience research in design, Consumer-focused design