: Debugging with Monitor Tool")
Optimize Power Apps (Model Driven App): Debugging with Monitor Tool
Learn how to take advantage of your business data with Microsoft Dynamics 365 & Power Platform & Cross Technologies. My name is Sanjaya Prakash Pradhan and I am a Microsoft Certified Trainer (MCT) and
Debug Dynamics 365 Apps Efficiently with Power Apps Monitor Tool
Key insights
- Debug Model-Driven Apps efficiently using the Monitor tool in Power Apps to identify and solve issues.
- Collaborative Debugging is achievable with a support engineer or for another user's session, enhancing troubleshooting.
- Monitor tool requires model-driven app client version 1.4.5973-2307.2 or later for optimal functionality.
- Monitor sessions provide insights into page navigation, command executions, form saves, and more, facilitating a deeper understanding of app performance.
- Identifying Custom Script Errors and slow performance issues is streamlined, allowing for quicker resolutions and improved app efficiency.
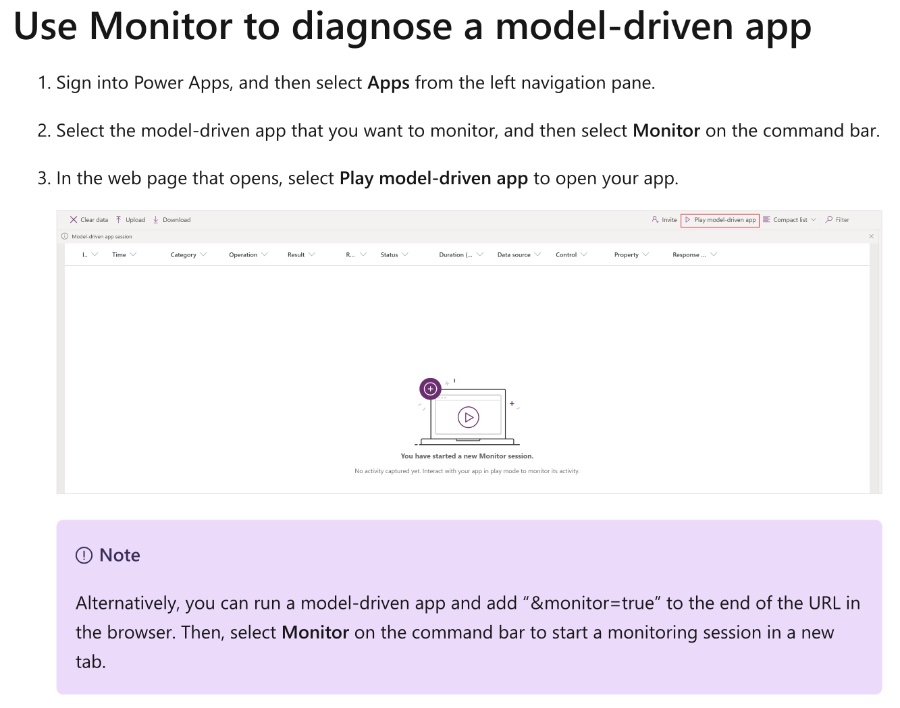
- You can run a model-driven app and add “&monitor=true” to the end of the URL in the browser. Then, select Monitor on the command bar to start a monitoring session in a new tab.
Understanding the Dynamics of Debugging Model-Driven Apps
The capability to debug model-driven applications effectively is crucial for developing robust and efficient apps within the Dynamics 365 environment. The integration of the Monitor tool in Power Apps represents a significant leap forward in facilitating this process. By offering an expansive view of an app's internal operations, developers can now pinpoint and resolve issues with unprecedented precision. This capability is not only limited to personal debugging sessions but extends to collaborative efforts alongside support engineers or even when analyzing the issues experienced by another user. The requirement for a specific client version underscores the need for developers to keep their tools up-to-date to leverage these advanced debugging features fully.
The practical benefits of utilizing the Monitor tool extend beyond the mere identification of issues. By examining events such as page navigation, command executions, and form saves, developers can gain insights into the performance indicators that truly matter. The differentiation between types of loads, such as 'FullLoad' events, offers a granular analysis of loading sequences, empowering developers to streamline and optimize the user experience further. In instances of custom script errors or slow performance, the Monitor tool proves instrumental in diagnosing the root causes, whether they stem from inefficient scripting practices or the utilization of synchronous XMLHttpRequests. This diagnostic capability ensures that developers can implement effective solutions, substantially improving the reliability and speed of model-driven apps.
Softchief Learn's latest YouTube video delves deep into the intricacies of debugging a Model-Driven App with the help of Power Apps' Monitor tool. Specifically designed for Dynamics 365 Customer Engagement CRM, this tool offers an unprecedented view into the app's operations, logging all significant activities as they unfold. The inclusion of collaborative debugging with support engineers enriches the troubleshooting experience, providing a straightforward path to resolving user session issues.
Exploring Monitor Tool for Enhanced App Performance
Model-driven apps, as part of the Dynamics 365 suite, are powerful platforms for creating complex business applications. The debugging process, crucial for any app's lifecycle, ensures these apps run efficiently and effectively. Power Apps' Monitor tool is a game-changer in this regard, offering deep insights into an app's performance and highlighting areas for improvement. It allows developers to see real-time events, diagnose problems, and optimize app operations collaboratively.
By enabling a detailed view of events such as page navigation and command executions, the Monitor helps in identifying performance bottlenecks. The tool’s ability to detail out specific events like "FullLoad" and "Network" requests further allows developers to pinpoint performance issues, offering a pathway to enhancing user experience. Custom script errors and slow performance issues can also be navigated effectively with this tool, ensuring that Model-Driven Apps meet the high-performance standards expected by users.
Moreover, the integration of collaborative debugging features fosters a more inclusive approach to problem-solving. Developers can join forces with support engineers or even involve users experiencing issues, to get to the root of the problem faster. This community-centric approach not only speeds up the debugging process but also enhances the learning curve for developers.
Softchief Learn's initiative to replace GitHub Issues with a more streamlined feedback system in 2024 signals a commitment to improving user engagement and responsiveness. With a focus on enhancing the overall development and debugging experience, this move is set to benefit both developers and end-users alike.
Overall, Power Apps' Monitor tool stands out as a pivotal development in the realm of Model-Driven Apps, offering a robust framework for debugging and optimizing apps. Its comprehensive feature set, coupled with future improvements in user feedback mechanisms, positions Dynamics 365 apps for greater success and user satisfaction.

People also ask
How do I Debug a model-driven app?
To debug a model-driven app, you must click on the play button within the model ribbon app, which will subsequently launch the model-driven app.
How do I use the monitor to troubleshoot power apps?
To troubleshoot Power Apps using Monitor, you should first log into Power Apps, then proceed to either create a new app or edit an existing one. Afterward, navigate to the left pane and select Advanced Tools -> Open monitor. By doing so, PowerApps Monitor will be initiated in a new browser tab and will establish a connection with your active app session. With the monitor active, you can return to the app and initiate playback.
How do you test a form in the model-driven app?
For unit testing model-driven forms within Angular environments, the process involves a straightforward examination of the form model itself. Conversely, when dealing with template-driven forms, a comprehensive end-to-end testing environment that includes browser interaction is necessary. Subsequently, we will explore methodologies for testing applications that generate HTTP requests.
How do I monitor Power Apps performance?
To initiate the Monitor for a published application, you simply open Monitor.
Keywords
Debug Model Driven App, Monitor Tool Power Apps, Power Apps Debugging, Model Driven Application Debug, Debugging in Power Apps, Monitor PowerApps Tool, Model Driven PowerApps Debug, Power Apps Model Driven Performance