
Power BI: How to Create Measures from Filtered Visuals
Capture dynamic insights! Learn how to create and apply filtered DAX measures in Power BI for tailored data analysis.
Create a measure from a filtered visual in Power BI? Absolutely! A live stream question addressed whether it's possible to develop a DAX measure straight from a filtered visual on a Power BI report, and the answer is yes. Patrick showcases the new DAX Query view in Power BI Desktop, demonstrating exactly how you can do this.
Creating a measure from a filtered visual involves two key processes: first, you craft the measure using the filtered data, and secondly, you apply the filter directly to the measure to refine your results. Understanding these steps can unlock dynamic filtering capabilities in your reports.
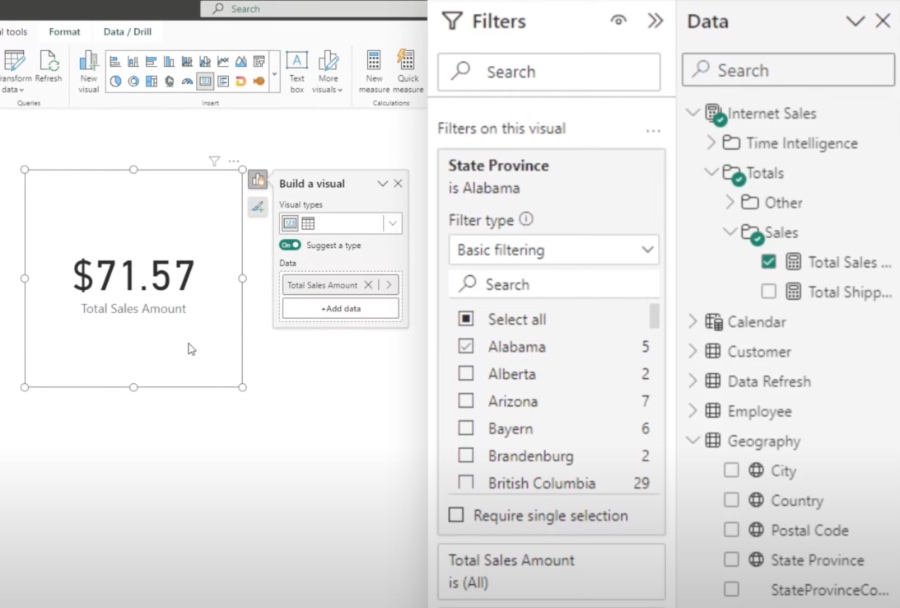
The initial step is to establish the measure. Start by pinpointing the visual filter, which involves identifying the visual that holds the filter criteria you wish to apply. Next, compose a DAX formula that integrates the specified filtering conditions, using functions like FILTER to limit the calculation scope correctly. Lastly, give your new measure a meaningful name that encapsulates its function and the filtered data it's based upon.
Once you have your measure, it's time to apply the filter. Navigate to the visual filter pane associated with the visual in question. Then, drag the newly created measure from the 'Measures' pane into the 'Visual Level Filter' space. Choose a filter operator that aligns with what you're trying to achieve, like 'Top 5' for highlighting your most prominent values. Lastly, set the filter values to refine your measure—a step that may differ depending on your specific measure, such as setting 'Sales' to showcase the top five values.
By adhering to these straightforward guidelines, you can build and incorporate measures based on filtered visuals within your Power BI toolkit, thus making your filtering and data analysis tasks both dynamic and specific to your reporting needs. This method ensures that your data visualization remains accurate and targeted towards the information that matters most to your analysis.
Understanding Power BI Measure Creation
Creating specific measures within a business intelligence suite like Power BI is crucial for detailed data analysis. Users commonly seek to tailor their data visualizations to reflect precise subsets of data, often necessitating the development of measures that adapt to various filters. This ability to dynamically adjust measures ensures that your analysis is not just powerful but also incredibly nuanced, catering to complex reporting needs across diverse data sets. In essence, learning to craft these measures within a filtered context serves to heighten the analytical power at your disposal, offering tailored insights and a more granular understanding of your data landscape.
Create a measure from a filtered visual in data analysis tools? Of course, you can! A question during a live stream asked if it is possible to construct a DAX measure based on a filtered visual in a report. Patrick demonstrates the use of the new DAX Query view in the report builder to guide you through the process.
To construct a measure using a filtered visual involves a couple of foundational actions: firstly, crafting the measure with the filtered data in consideration, and secondly, integrating the filter into the measure itself.
Create the Measure and Apply the Filter
Formulate the Measure
- Determine which visual contains the filter criteria you wish to use.
- Devise a DAX formula that includes the specified criteria from the visual. For example, incorporating a category filter may entail employing a function to limit the scope of your calculation to the relevant entries.
- Choose a meaningful name for your measure that accurately conveys its intent and the data it reflects.
Integrate the Filter onto the Visual
- Identify the visual where the newly created measure's filter will be placed.
- Move your measure into the 'Visual Level Filter' section on the visual you've selected.
- Opt for the filter operator that aligns with your intended results. For instance, selecting 'Top 5' if you aim to showcase the highest five entries.
- Make any necessary adjustments to the filter parameters, such as setting the filter to include the top five sales figures if that is the focus of your measure.
By adhering to the outlined steps, one can seamlessly generate a measure grounded on a filtered visual, enabling dynamic and specific data filtering capabilities.
Understanding how to generate measures from filtered visuals is essential for users looking to streamline their data presentation and enhance data-driven decision-making. The ability to employ visual-level filters to interactively modify data in reports is a powerful feature of contemporary data analysis software, allowing for more targeted insights and report customization.
Further Insights on Data Analysis and Reporting
Data analysis and visualization platforms empower businesses to derive actionable insights and make informed decisions. Crafting measures from filtered visuals is a nuanced skill that can enhance reporting by providing targeted data views. With this capability, analysts can tailor reports to specific audiences, deliver more impactful presentations, and optimize data exploration efforts. It's crucial for professionals seeking to utilize data effectively to understand these concepts and integrate them into their analytical toolbox.

People also ask
How do you create a measure with a filter in Power BI?
To create a measure with a filter in Power BI, you can use DAX (Data Analysis Expressions) to define the measure. To apply a filter within the measure, use functions like CALCULATE, which allows you to perform calculations over a filtered data set. The syntax would include the measure you’re calculating and the filter context, often applying filtering functions like FILTER, ALL, or related tables.How do I create a measure based on a column in Power BI?
Creating a measure based on a column in Power BI is done by using the "New Measure" button in the modeling tab. Once you click on this, you can write a DAX formula that defines your measure, which could be as simple as summing up a column (SUM(TableName[ColumnName])) or more complex expressions involving various DAX functions that reference the column you're interested in.How do I apply a filter to a specific visual in Power BI?
To apply a filter to a specific visual in Power BI, select the visual you wish to filter. Then, use the "Filters" pane that appears on the right side of the desktop application. In this pane, you can add filters at different levels: visual level, page level, or report level. Drag and drop the desired fields into the filter area, and specify the filter criteria for the selected visual.Which is a Power BI visual that allows us to set a filter on the Visualizations in the report?
A Slicer is a Power BI visual that allows users to set filters on the visualizations within a report. The slicer acts as an interactive filter to the report canvas, where end-users can click to select different elements to filter the data displayed on other visuals present in the report. Slicers can filter on a specific column, and multiple slicers can be used for complex filtering needs.Keywords
Power BI Measure Creation, Filtered Visuals Power BI, Power BI Tutorial, DAX Measure Power BI, Power BI Visual Filtering, Power BI Report Design, Create Measures in Power BI, Power BI Data Analysis, Advanced Power BI Techniques, Power BI Interactive Reports