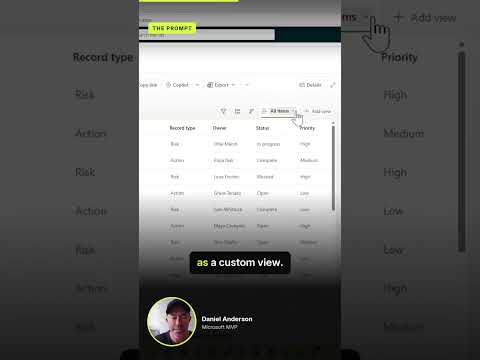
SharePoint Copilot: create a live dashboard from a prompt
A Microsoft MVP 𝗁𝖾𝗅𝗉𝗂𝗇𝗀 develop careers, scale and 𝗀𝗋𝗈𝗐 businesses 𝖻𝗒 𝖾𝗆𝗉𝗈𝗐𝖾𝗋𝗂𝗇𝗀 everyone 𝗍𝗈 𝖺𝖼𝗁𝗂𝖾𝗏𝖾 𝗆𝗈𝗋𝖾 𝗐𝗂𝗍𝗁 𝖬𝗂𝖼𝗋𝗈𝗌𝗈𝖿𝗍 𝟥𝟨𝟧
Copilot in SharePoint can turn structured list or file data into an interactive dashboard that stays connected to its source.
Key insights
- The described dashboard can use a SharePoint List, Excel workbook, or CSV file as its data source.
- Copilot generates an interactive HTML report from a natural-language description.
- The dashboard is intended to retrieve current source data when reopened or refreshed.
- The research notes say Microsoft 365 Copilot licensing is required for relevant users.
- The notes describe a progressive general availability rollout, but no official Microsoft source is provided here.
Copilot in SharePoint can generate an interactive dashboard from a prompt and structured data, with the dashboard designed to stay connected to its source. This is relevant to SharePoint users who need a lightweight view of operational data, such as project status or expenses. Daniel Anderson [MVP] is the source of the demonstration behind this example of prompt-driven dashboard creation.
What it does
The described feature turns a natural-language request into an interactive HTML report. A prompt can specify the audience, measures, charts, filters, or summaries the dashboard should contain. For example, a project portfolio view could show project health, milestones, risks, budget status, and owners.
The key distinction from a static export is the intended connection to the underlying data. The research notes say the dashboard can retrieve updated information when reopened or refreshed, rather than relying only on a snapshot taken when it was created. The notes identify SharePoint Lists, Excel workbooks, and CSV files as possible sources.
Who it is for and what you need
This approach is aimed at users who want a focused, interactive view without first building a full reporting solution. The notes mention project tracking, issue management, inventories, event planning, and expenses as possible lightweight scenarios. They also say Microsoft 365 Copilot licensing is required for the relevant users.
The notes describe general availability as beginning with a progressive rollout across tenants. They do not provide an official Microsoft source in the supplied sources, so the rollout details and licensing should be checked against current Microsoft guidance before planning deployment. The specific tenant settings, geographic availability, and exact file requirements are not stated.
How it works
- Prepare structured data in a SharePoint List, Excel workbook, or CSV file.
- Open Copilot in SharePoint and describe the dashboard, including the metrics and visual elements you need.
- Review the generated HTML report and refine it with follow-up prompts, such as asking for filters or a different layout.
- Save it in an appropriate SharePoint location, then reopen or refresh it to work with current source data.
Check calculations, labels, filters, and interpretations before using the output to make decisions. Clear, consistent source columns and values can help make the requested view easier to specify.
Limitations and open questions
The supplied material does not establish which dashboard features are available in each tenant or explain detailed setup, sharing, or governance controls. It also does not include an official Microsoft reference to independently verify the stated licensing and rollout. Treat the report as a lightweight reporting option, not as a replacement for a governed analytics solution; the research notes explicitly distinguish it from Power BI's fuller modeling and governance capabilities.
Sources
Frequently asked questions
What data can a Copilot in SharePoint dashboard use?
The supplied research notes list a SharePoint List, Excel workbook, or CSV file as possible sources.
Does the SharePoint dashboard update when its data changes?
The dashboard is described as connected to its source and able to retrieve current information when reopened or refreshed. The supplied material does not explain the refresh mechanism in detail.
What license is needed to create a Copilot dashboard in SharePoint?
The research notes say Microsoft 365 Copilot licensing is required for relevant users. No official Microsoft licensing source was included, so confirm current requirements with Microsoft.
Is Copilot dashboard generation available in every SharePoint tenant?
The notes describe a progressive rollout, not simultaneous availability everywhere. Tenant-specific availability is not established by the supplied sources.