
Calculation groups for beginners | Power Bi update October 2023
Master Power BIs Calculation Groups feature with our in-depth guide - simplifying data analysis and enhancing modeling capabilities!
The YouTube video "Calculation groups for beginners | Power BI update October 2023" by Curbal provides a precious introduction to a powerful tool in Power BI called Calculation Groups. The ability of Power BI to transform raw data into significant insights is widely recognized.
The video highlights one such potent tool - Calculation Groups, which aids in data modelling and diminishing the number of measures. Their functionality includes addressing issues of redundancy and simplifying calculations, thus enhancing user experience and efficiency. Noteable, though some detail about Power BI could be useful.
Understanding Calculation Groups
Calculation Groups act as containers for a set of calculation items, helping users apply different measures based on conditions. The video provides a real-world example to elaborate the concept further. Considering a fact table with multiple metrics (sales, costs, profit), Calculation Groups efficiently provide insights without creating separate measures for each metric, thereby reducing redundancy. They upgrade the approach to data analysing by availing a unified structure for calculations.
Creating Calculation Groups
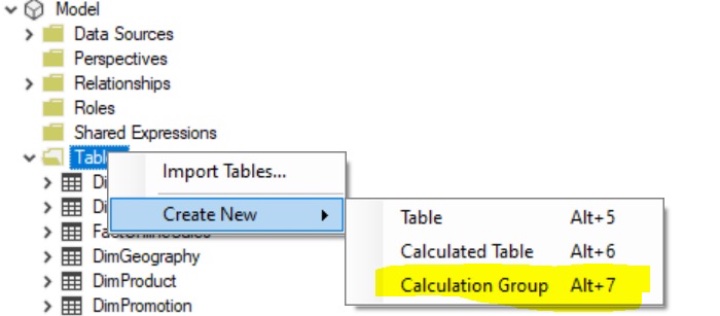
To build a Calculation Group in Power BI, external tools such as Tabular Editor are required. The video guides users through various steps such as installation of Tabular Editor, connection to Power BI data model, defining Calculation Group and logic and saving and applying changes.
Once created, they can be easily applied through a set of well-laid instructions. This approach significantly trims down overall measures, making the data model manageable and maintainable, hence, simplifying the process of providing insights.
Pros and Cons
Major benefits of Calculation Groups include a decrease in redundancy and duplicative logic, flexibility in formatting and helpful for time intelligence calculations. However, the need for external tools for creation might serve as a hindrance for some users.
Despite this minor limitation, the introduction to Calculation Groups by Curbal successfully demonstrates their potential in improving data modelling capabilities, thereby enabling users to analyse data efficiently while maintaining a clean and organized model.
General Overview
Modern data analytics tools like Power BI are immensely resourceful when it comes to mining meaningful insights from raw data. Power BI's features like Calculation Groups specifically offer a simplified and efficient approach to managing large data sets. By reducing redundancy, avoiding duplicative logic, and allowing for dynamic application of calculations, these Power BI features significantly enhance the data analysis process. Essential for better decision-making, they pave the way for a more concise data model, delivering clearer insights.

Learn about Calculation groups for beginners | Power Bi update October 2023
In the rapidly developing sphere of data analytics, the "Microsoft Power BI" stands as an eminent tool, converting unprocessed data into meaningful knowledge. A crucial feature, Calculation Groups, has appeared as an influential technique to augment data modeling and lessen the quantity of measures. This article aims to demystify what Calculation Groups denote, how to construct them, and study an actual use case. Furthermore, we will emphasize the perks and constraints of applying Calculation Groups in the analytics platform.
Calculation Groups have been integrated into the analytics platform to tackle issues of handling large quantities of unnecessary measures and to ease the logic applied in distinct calculations. A Calculation Group can be described as a containment for multiple calculation items, letting users to employ variants of measures relying on certain conditions. This effectively lets users outline and enforce computational logic dynamically, bypassing the need for numerous analogous measures with insignificant variations.
Imagine handling a data table containing varied metrics like sale amounts, quantities, costs, discounts, profits, and others. Giving users more depth about metrics like former month/quarter/year, year-to-date, or year-over-year comparison, customarily involves generating distinct measures for each metric and time analysis. This results in a large quantity of measures with duplicated logic, which can be tough to manage.
Here is where Calculation Groups come for the rescue. As opposed to creating various redundant measures, a placeholder measure can be used and define calculation items to be employed on it. Let's unravel this with a simple illustration:
- Placeholder Measure: It's a dynamic measure which evaluates the measure presently in the context, based on user choices or filters. For instance, if the user picks "sale amount," the Placeholder Measure will signify the sale amount. Now, we define multiple calculation items that will be employed on the Placeholder Measure. These calculation items exhibit additional info that business users may wish to see, such as year-to-date computation and prior year computation.
- Year-to-date calculation: This calculation item computes the selected measure's value from the inception of the present year until the selected date.
- Previous year calculation: This item computes the selected measure's value for the same interval in the past year. With Calculation Groups, you build a combined structure to tackle various computations dynamically, implying you only require one Placeholder Measure and few computation items instead of creating separate measures for each metric and time-based computation.
The method to construct a Calculation Group in the analytics tool requires the use of external software such as Tabular Editor. Tabular Editor is an advanced device for managing data models of the platform. To use the newly created Calculation Group in the analytics tool, go back to your report and refresh the data model to include the newly created Calculation Group.
Some advantages of Calculation Groups include lesser redundancy, avoiding duplication of logic, and flexibility in time intelligence and formatting. On the downside, Calculation Groups can only be created using external tools like Tabular Editor, which may not be convenient for some users.
In conclusion, Calculation Groups are an influential feature that enhances the data modeling abilities of the Power BI. They allow users to inspect data more efficiently by minimizing measure redundancy and offering a dynamic method to switch between distinct computations. Users can create more concise and maintainable data models with Calculation Groups, leading to clearer insights and improved decision making.
More links on about Calculation groups for beginners | Power Bi update October 2023
- Power BI October 2023 Feature Summary
- Oct 11, 2023 — Calculation groups is a powerful feature that allows you to apply dynamic calculations to your existing measures. For example, you can create a ...
- Author calculation groups
- Oct 26, 2023 — Author calculation groups in Power BI Desktop to enable the reuse of common measure expressions in complex semantic models.
Keywords
Power Bi, Calculation Groups, Beginners Guide, October 2023 update, Power Bi 2023, Beginner Calculation groups, Power Bi Beginners, BI Calculation Update, 2023 Calculation Groups, Power Update October