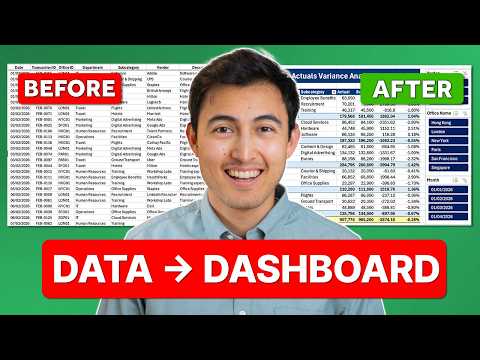
Excel: Automate Your Actuals vs Budget
Co-Founder at Career Principles | Microsoft MVP
Automate budget vs actuals in Excel with Power Query and PivotTables for auto-refresh finance reports and slicers
Key insights
- Workflow overview: Use Power Query to import monthly actuals from a folder, then combine that data with a separate budget file and load the result to a PivotTable for reporting.
Build the process once so the report updates automatically when you refresh. - Data preparation: Clean and standardize source files, then group transactions by month, office, department, and subcategory to create consistent tables for reporting.
Consistent column names and formats make refreshes reliable. - Merging and lookup: Merge the consolidated actuals with the budget table and add an office lookup to replace IDs with human-readable fields like office name, region, and country.
This mapping ensures actuals and budget roll up to the same reporting lines. - Calculations and reporting: Build the report to show Actual, Budget, Variance, and Variance % in a PivotTable, and add slicers for month and region to enable interactive analysis.
For larger models, use the Data Model and optional DAX measures for faster calculations. - Automation and refresh: After setup, adding a new month’s file to the folder and clicking refresh updates all queries and the PivotTable—no manual rebuilds required.
Test refreshes regularly to confirm new files match the expected structure. - Benefits and best practices: Automating reduces manual errors, speeds the reporting cycle, and scales better than ad hoc formulas; keep a single source of truth, name queries clearly, and document your steps as a best practice for finance teams.
Run a monthly automation test to ensure continuity during month-end close.
Overview
Kenji Farré (Kenji Explains) [MVP] published a YouTube video that walks through automating an Actuals vs Budget report in Excel using a no-code approach. The presentation focuses on using Power Query to pull monthly actuals from a folder, clean and group the data, and then merge it with a separate Budget file. Consequently, the resulting workbook feeds a refreshable PivotTable that updates when new monthly files are added.
How the workflow works
First, the video demonstrates connecting Power Query to a folder of monthly actuals files and applying consistent transformations so every file merges cleanly. Next, the author shows adding a budget table and an office lookup table so the report can display meaningful fields like office name, region, and country rather than just an ID. Finally, the combined data is loaded into Excel and used to build a PivotTable with slicers for month and region, making the report interactive and easy to explore.
Key mechanics and choices
The method relies on structured tables and query steps that run in the same way each month, so once you set it up you rarely need to rebuild anything. Moreover, the video emphasizes avoiding fragile copy-paste processes by using refreshable queries and a consistent folder-based input, which reduces errors and speeds up the reporting cycle. As a result, analysts can add a new month’s actuals file to the folder and then refresh the queries and pivot to see updated numbers.
Benefits and efficiency gains
One clear advantage is reduced manual work: instead of recreating reports each month, you refresh a few queries and the dashboard updates automatically, which saves time during close. Additionally, because the workflow uses centralized mapping and lookup tables, it produces more consistent rollups and cleaner variance analysis across departments and regions. Therefore, teams can focus on interpreting results rather than correcting repetitive data preparation mistakes.
Tradeoffs and design considerations
However, the automated approach involves tradeoffs that teams must weigh carefully: while Power Query simplifies ETL tasks, it also centralizes transformations that require governance and documentation. For example, if source files change structure or column names, those applied steps can break and demand maintenance, so there is an operational cost to managing schema drift. Thus, balancing ease of refresh with robust change management is essential to keep the solution reliable.
Scalability and performance
Using the Excel Data Model and relationships can improve performance for larger datasets, but it moves the workbook into a more complex territory that may require learning basic DAX measures. Conversely, simple formula-driven dashboards with SUMIFS or XLOOKUP work well for small, stable datasets but become slow and hard to maintain as volume grows. Consequently, teams should choose the simpler approach when data is limited and adopt the Data Model when they expect growth or need multi-dimensional analysis.
Common challenges to expect
Kenji highlights practical pitfalls such as mismatched account mappings, inconsistent file naming, and missing budget months, all of which can distort variance calculations if not addressed. Moreover, large volumes of transaction-level actuals can increase refresh times and push workbooks toward memory limits, which complicates day-to-day use. Therefore, testing with representative data and documenting mapping logic are crucial preventive steps.
Practical tips and best practices
To reduce friction, the video recommends keeping source files consistent, using a folder feed for monthly files, and building a clear mapping or chart-of-accounts table that both actuals and budget use. Also, it suggests validating refreshes after adding new files and saving transformation steps in readable names so other analysts can follow them. Ultimately, these small habits keep the automation dependable and easier to hand off.
User experience and reporting
The final report in the demonstration uses a pivot with variance and variance percentage alongside slicers, which makes it straightforward for managers to slice by month, region, or office. In addition, the author shows how to replace IDs with readable names from the lookup table to improve clarity and make the dashboard more user-friendly. Therefore, thoughtful presentation complements the technical automation to increase adoption and usefulness.
When not to automate
Automation makes sense when file formats are stable and the team can support occasional maintenance, but it may not be worth it for ad hoc or one-off reports. Furthermore, if the budget process itself changes frequently or requires manual judgment each period, rigid automation may create extra rework. Thus, teams should evaluate the frequency and predictability of their data before committing to a fully automated pipeline.
Conclusion and next steps
Kenji Farré’s video offers a practical, hands-on path to turning repetitive monthly reporting into a refreshable Excel pipeline using Power Query and PivotTable techniques. While the approach reduces manual effort and improves consistency, it also requires governance, testing, and occasional maintenance to handle schema changes and large datasets. Consequently, viewers should prototype the method with a few months of data, document transformations, and plan for ongoing governance before scaling it across an organization.

Keywords
automate actuals vs budget excel, excel automate budget vs actuals report, actuals vs budget report automation, power query actuals vs budget, excel pivot actuals vs budget, scheduled excel budget vs actuals update, excel financial reporting automation, reconcile actuals and budget excel