- All of Microsoft

Create a GPT-4 Enhanced Excel Dashboard Quickly
Microsoft MVP | Author | Speaker | Power BI & Excel Developer & Instructor | Power Query & XLOOKUP | Purpose: Making life easier for people & improving the quality of information for decision makers
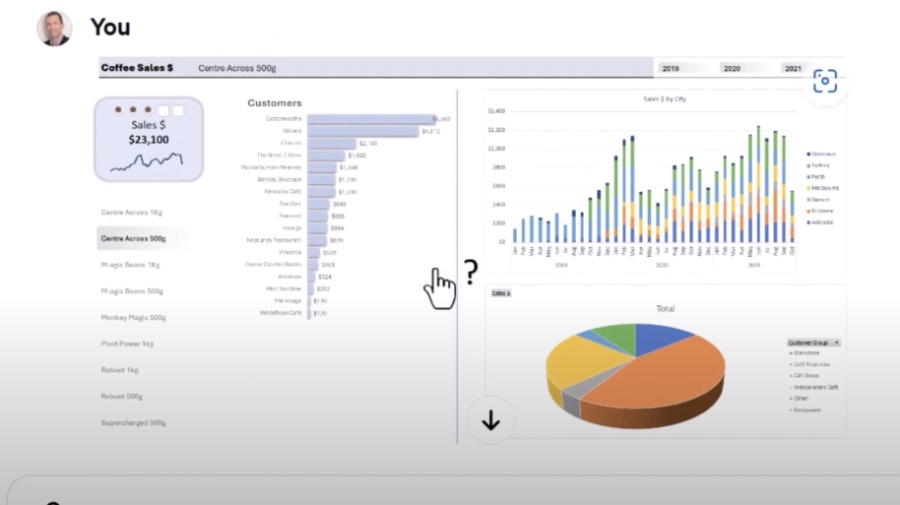
Revolutionize Data Analysis with Excel Dashboards & Harness GPT-4 for Custom AI Solutions
Build a better dashboard using spreadsheet software and develop your own GPT with the latest GPT4 technology. Data Vizard promotes interactivity by posing probing questions concerning your dashboard's objective and the decisions it aids. Tailored suggestions arise from this practice, elevating effectiveness.
The guidance caters to specific contexts and objectives, suggesting enhancements to clarify data utility for the audience. By pinpointing the dashboard's purpose, Data Vizard can suggest the most appropriate visualizations and components to narrate the data's story. The visual and operational effectiveness of the dashboard increases, bolstering informed decision-making.

An article provides insights into crafting superior dashboard interfaces in spreadsheet software and developing a personalized GPT model with GPT4. Most dashboards suffer from ineffective design and usability, causing suboptimal business decisions. Tips to elevate dashboard quality will be shared in the article.
Dashboards graphically represent crucial data metrics, offering a snapshot of vital information. Utilized in business environments, dashboards track progress, spot trends, and support decisions. An effective dashboard stands out for its simplicity, clarity, and user-friendliness.
Visualization plays a key role in dashboard transparency, making complex data accessible. To be most effective, it should present a well-organized interface, allowing users to swiftly locate necessary metrics. Here are practical steps to enhance your dashboard:
- Maintain simplicity to emphasize the critical metrics, using visuals for clearer communication.
- Color is a powerful communicator; employed thoughtfully, it can demystify dashboard information.
- Consistent formatting across dashboard elements contributes to a polished, professional appearance.
- Integrate filters and slicers to rapidly analyze data subsets, which helps in drawing comparisons and detecting trends.
GPT-4 by OpenAI is an impressive linguistic model that mimics human writing, translates languages, crafts varied content, and answers queries effectively. Steps to craft a GPT model with GPT4 will be discussed, with emphasis on essential steps from account creation to API utilization.
GPT models are powerful neural networks trained on extensive text and code, employable for text generation, language translation, and creative content creation. To build a GPT model using GPT4, you'll need to follow several steps:
- Create an account on OpenAI for GPT4 API access.
- Select a coding language compatible with GPT4, like Python, Java, or C++.
- Set up a virtual environment to avoid software conflicts.
- Install necessary libraries for GPT4 usage.
- Construct a function for GPT4 API communication, which sends text and retrieves the model's output.
Your own GPT model can be utilized to generate creative works, perform translations, and compose various forms of content. The capabilities range from poetry and language translation to blog post creation.
In conclusion, Excel dashboards and GPT models stand as twin pillars to amplify efficiency. Adherence to the provided guide can lead to the development of superior dashboard interfaces in Excel and the ability to generate multidimensional content using GPT models.
Better Dashboard Design and GPT-4 Capabilities
Creating effective dashboards in Excel is crucial for visualizing and analyzing data. Many dashboards, however, fall short in design, causing difficulty in use and potentially leading to suboptimal decision-making. Therefore, it's important to focus on enhancing dashboard readability and usability to support better business decisions.
Dashboards provide an at-a-glance view of key metrics and are widely used in business environments to monitor performance, spot trends, and drive strategic decisions. Yet, for a dashboard to be truly useful, it must be well-designed, prioritizing clarity and accessibility to ensure key information stands out.
To design an exceptional dashboard, simplicity is key; this means focusing on the most important metrics and using visual elements to highlight them. Effective use of color and consistent formatting go a long way in increasing the clarity and professionalism of a dashboard, making it an invaluable tool.
- Keep it simple: Aim for a minimalistic design to prevent information overload.
- Use color effectively: Employ color thoughtfully for emphasis and organization.
- Use consistent formatting: Maintain uniform presentation styles for coherence.
- Use filters and slicers: Incorporate tools for examining various data segments.
Building your own GPT with the fourth iteration, known as GPT-4, is an ambitious task that can yield a wide array of applications, from text generation to language translation and creative content development. GPT-4's advanced capabilities stem from its training on extensive datasets comprising text and code.
People also ask
Can GPT 4 work with Excel?
Can ChatGPT make an Excel dashboard?
ChatGPT can help in designing an Excel dashboard by providing instructions or scripting the layout, but it cannot create a dashboard directly in Excel as it does not have the ability to manipulate software. Users would need to implement the steps or code provided by ChatGPT to construct the dashboard.Can ChatGPT build an Excel spreadsheet?
ChatGPT can guide users through building an Excel spreadsheet by offering step-by-step instructions, generating formulas, or suggesting the organization of data. Nonetheless, it doesn't have the capability to directly interact with Excel software to physically build a spreadsheet.Can you use GPT in Excel?
While you cannot directly use GPT within Excel, there are ways to interact with GPT-powered applications or services from within Excel, such as custom integrations, add-ins, or linking to an external GPT-based service using Excel's scripting features like Office Scripts or VBA (Visual Basic for Applications) to send and process data.Keywords
excel dashboard tips, build GPT-4 model, custom GPT AI tutorial, create own GPT-4, GPT-4 dashboard integration, Excel GPT-4 guide, advanced Excel visualization, DIY GPT-4 AI, personalized GPT chatbot development, Excel dashboard enhancement
