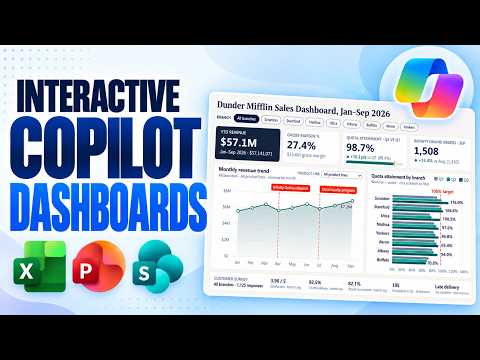
Excel Copilot creates interactive dashboards from workbooks
Principal Group Product Manager - Microsoft Education
Excel Copilot can turn workbook data into an interactive dashboard with charts, filters and what-if controls for people analyzing business data.
Key insights
- Excel's dashboard feature is called Interactive Canvas and is in Frontier Preview, according to the source material.
- Copilot can create dashboards from a workbook prompt and refine them with follow-up natural-language instructions.
- The demonstrated dashboards include filters, charts and what-if sliders for exploring assumptions.
- The video description says Excel dashboard rollout is expected broadly in late November or early December.
- Copilot dashboards are also demonstrated in PowerPoint and SharePoint, with different creation workflows.
Excel Copilot's Interactive Canvas can turn workbook data into an interactive dashboard with charts, filters and what-if controls, helping users explore information without building every visual from scratch. It matters to Excel users who need to summarize business data or compare scenarios. Mike Tholfsen demonstrates the workflow in a YouTube video, including dashboard creation and refinement through natural-language prompts.
What's new
The feature's official name in Excel is Interactive Canvas. Copilot creates an AI-generated sheet from the existing workbook, with dashboard elements such as KPI values, charts, filters and interactive controls. In the demonstration, one dashboard summarizes sales performance, including revenue, gross profit, gross margin and average order value.
The examples also show that the dashboard can be tailored to a specific question rather than only producing a general workbook summary. A prompt requests a churn analysis with year-over-year comparisons, territory rankings and a what-if panel. Copilot adds controls that let the user explore different assumptions and see projected churn change.
In the demonstrated workbook, the dashboard responds when source data is updated. Filters let users change the period, customer segment or region and inspect the results. This makes the output useful for exploring a workbook, not just presenting a fixed snapshot. For more Excel reporting coverage, see Excel articles and guidance.
Who it is for and what you need
Interactive Canvas is relevant to people who work with workbook data and want to analyze it through a dashboard, including business users preparing sales or operational reporting. The demonstration uses sales and account-churn data, but the source material does not define a complete list of supported data types or minimum workbook requirements.
The video description says users need a Copilot subscription to use the Excel and SharePoint dashboard experiences. It describes Excel Interactive Canvas as being in Microsoft 365 Frontier Preview in early November, with broader rollout expected in late November or early December. These are the rollout details supplied in the source material; it does not specify eligible plans, regions or tenant-level requirements.
The demonstration also covers related but distinct experiences in PowerPoint and SharePoint. PowerPoint can create interactive slides from workbook data, and the source describes its interactive slides as fully rolled out. SharePoint can create a dashboard from a selected file or generate an HTML dashboard from a list; the description says those experiences are globally rolled out. Those statements do not establish that every tenant or license can use them.
How it works
In the Excel demonstration, Copilot works from the workbook and a prompt describing the desired analysis. Users can begin broadly, then specify the metrics, comparisons and controls they want. The dashboard can also be revised after its first generation.
- Open the workbook and select the Copilot button. The demonstration locates it in the lower-right corner.
- Describe the dashboard you want, such as an interactive workbook summary with useful charts and what-if scenarios. For a focused report, identify the relevant sheet, measures, comparison period and ranking or filter requirements.
- Review the generated sheet. In the example, an AI-generated sheet icon identifies the new dashboard sheet.
- Use the available filters and controls to explore the data. The examples include time-period and segment filters, territory selection and sliders for changing scenario assumptions.
- Refine the result with another prompt. The churn example asks Copilot to add a what-if panel, then uses sliders to compare projected outcomes.
The dashboard design depends on what the user asks Copilot to build. A general prompt produces an overview; a detailed prompt can specify KPI cards, trends, rankings and scenarios. In the demonstration, updating the underlying worksheet data also updates the dashboard, so users can work with current workbook values rather than recreating the report manually.
Limitations and open questions
Excel's preview status and expected rollout timing mean users should not assume the feature is already available in their environment. The source material does not explain how to join Frontier Preview, which Copilot subscription plans qualify, or how availability varies by tenant or region. Check current Microsoft guidance and your own environment before planning a rollout.
The demonstration shows generated results, but it does not establish how Copilot validates calculations or handles every workbook structure. Users should review the metrics, filters and scenario assumptions before relying on a dashboard for decisions. The examples include explicitly labeled assumptions in a prompt, but the source does not describe a formal review or approval process.
PowerPoint and SharePoint offer other ways to present or share interactive dashboards, but they are not the same Excel feature. PowerPoint's interactive slide can be used in slide show mode, while SharePoint's examples include sharing or downloading a file-based dashboard and creating HTML from a list. The available material does not compare their full capabilities or explain how those outputs behave under all editing and sharing conditions.
Sources
Frequently asked questions
What is Excel Copilot Interactive Canvas?
Interactive Canvas is the name given in the source material to Excel's Copilot-generated dashboard experience. It creates an AI-generated sheet with elements such as charts, metrics, filters and what-if controls.
Is Excel Copilot Interactive Canvas generally available?
The source describes it as being in Microsoft 365 Frontier Preview in early November, with broader rollout expected in late November or early December. It does not confirm availability for every tenant, region or license.
Do I need a Copilot subscription to create an Excel dashboard?
The video description says a Copilot subscription is needed to use these features. It does not specify which subscription plans qualify.
Can an Excel Copilot dashboard update when workbook data changes?
The demonstration says the dashboard updates when data in the workbook sheets changes. The source material does not explain whether every workbook structure or data source behaves the same way.