Excel: 10 features for formatting, lists and Copilot
Co-Founder at Career Principles | Microsoft MVP
Excel users can format headings without merging cells, work with multiple values in a cell and reuse spreadsheet tasks with Copilot.
Key insights
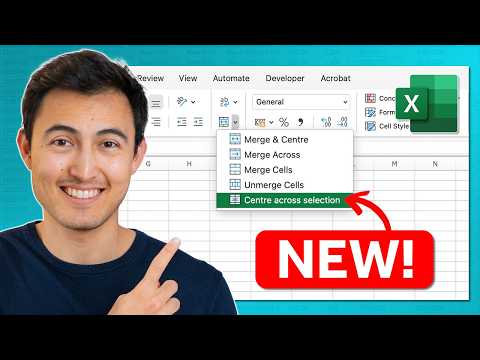
- Center Across Selection is available from the Merge & Center dropdown and keeps cells separate.
- List-formatted cells can contain multiple values that Excel can count, sum and filter individually.
- HAS, HASANY and HASALL check whether a list contains one or more specified values.
- The Create Table dialog can assign a descriptive table name instead of a default name.
- The demonstrated Copilot Skill Recorder captures spreadsheet steps for reuse on another dataset.
Excel’s demonstrated updates add easier formatting, multi-value cells, new list functions and Copilot-assisted ways to build reports and repeat tasks. They matter to spreadsheet users who format worksheets, analyze lists, maintain PivotTables or prepare recurring reports. Kenji Farré (Kenji Explains) [MVP] demonstrates these tasks and features in a YouTube video.
What's new
The features cover several different jobs rather than one coordinated change. Some are direct interface improvements: Center Across Selection is easier to find, and a table can be named as it is created. Others affect how data works, including list-formatted cells with multiple values and the HAS family of functions.
The Copilot examples are more substantial. The demonstration uses an Interactive Canvas to turn a financial model into an interactive dashboard, a Skill Recorder to capture spreadsheet actions, and a conversational Get Data experience to import and filter a CSV. The transcript also describes the removal of the COPILOT worksheet function and points users toward the main Copilot experience instead.
These functions and workflows address different needs. The formatting and table options fit routine workbook maintenance; list values and their functions are useful when a cell needs to hold several related items; and the Copilot features are aimed at users who want assistance with reporting, repeated work or data preparation.
Who it is for and what you need
Excel users who create workbooks, analyze lists, build PivotTables or repeat monthly spreadsheet steps can identify practical uses in the examples. The video demonstrates keyboard shortcuts, the Merge & Center dropdown, the Data tab, Copilot controls and a sample CSV file path. It does not state a required Excel edition, Microsoft 365 license, update channel, region or administrator setting.
That means the demonstration alone cannot establish whether a particular feature is available in your organization or Excel build. The transcript presents the items as updates, but does not identify their rollout stage or say which platforms support each one. Check the controls in your own Excel environment before planning a workflow around them.
How it works
For a centered heading that keeps the underlying cells separate, select the cells and open the dropdown beside Merge & Center. Choose Center Across Selection. The earlier route shown is Format Cells (Ctrl+1), Alignment, then Center Across Selection under Horizontal; the dropdown makes the setting quicker to reach.
For multiple values, the demonstration uses Ctrl+J to apply a cell’s list format. Excel then treats the entries as individual values for examples such as SUM and COUNT, rather than treating the comma-separated display as one ordinary value. Filtering can use either the combined Display Value or individual List Items.
- Apply the list format to the cell containing multiple values using Ctrl+J.
- Use HAS with a list range and a value such as "Spanish" to test for a match.
- Use HASANY with a set of values to test whether at least one is present, or HASALL to test whether all are present.
For tables, select a data range and press Ctrl+T. In the Create Table dialog, enter a meaningful name, such as the demonstrated Sep_Sales, before confirming. This avoids leaving the new table with a generic default name.
The PivotTable example enables Auto Refresh so that a change in the source data updates the displayed result without manually pressing Refresh. For the Copilot workflows, the Interactive Canvas is requested through Copilot with a prompt describing the desired dashboard; the example adds controls such as sliders and clickable tags. The Skill Recorder is opened from Copilot’s plus menu with Record a skill, then the user performs the task, stops recording, answers reuse questions and saves the skill.
For Get Data, the demonstrated route is to start a Copilot chat, choose Get Data and describe the file and transformations in natural language. The example names a CSV file and asks to keep completed orders while excluding other statuses; the result appears in a new worksheet. This is presented as an alternative to manually navigating the Data tab’s Get Data flow and working in Power Query.
Limitations and open questions
The transcript is a feature demonstration, not a licensing or rollout reference. It does not confirm availability by platform, plan, tenant or update channel, and the specific steps may not appear in every user’s interface. The video also does not provide a Microsoft support page or documentation link for validating the features.
There are practical caveats in the demonstrated Copilot workflows. The presenter says the Interactive Canvas is not directly editable like a normal worksheet: its cells and formula bar are unavailable in the example, making the calculations harder to inspect. The Skill Recorder example succeeds on a longer dataset, but does not establish how reliably it handles other workbooks or variations.
The transcript describes the COPILOT worksheet function as discontinued and directs users to Excel’s main Copilot experience, but does not give a support link or explain migration details. The traditional alternatives named include formatting through Format Cells, manually refreshing PivotTables, creating tables before renaming them, and using Power Query for imports. For more Excel coverage, see HubSite 365’s topic page.
Sources
Frequently asked questions
How do I center text across cells without merging them in Excel?
Select the cells, open the dropdown beside Merge & Center, and choose Center Across Selection. The demonstrated older route is Format Cells (Ctrl+1) > Alignment > Horizontal.
How do Excel list cells and HAS functions work?
The demonstration applies list format with Ctrl+J so a cell can contain multiple values that Excel can count, sum and filter as individual items. HAS checks for a value, HASANY checks for at least one of several values, and HASALL checks for all specified values.
What Excel license do I need for the Copilot features shown?
The source material does not state licensing requirements, supported plans or availability by platform. Check your own Excel environment; the demonstration does not confirm that every user will see these controls.
Can I edit an Excel Interactive Canvas like a worksheet?
In the demonstrated example, the canvas is a separate interface without editable cells or a formula bar. The presenter also notes that the calculations are not easy to inspect there.