- All of Microsoft

AI-Powered Decomposition Tree in Power BI
Unlock Data Insights: Explore Power BIs Decomposition Tree for Dynamic Data Analysis & AI-Driven Segments!
Key insights
The Essence of Decomposition Tree Visuals in Power BI
In a recent tutorial led by Angelica, the remarkable capabilities of the Decomposition Tree visual in Power BI were showcased, underlining its role as a pivotal tool for data analysis. This visual aids users in delving into their dataset, allowing them to decompose and examine it through various dimensions. It's designed to elevate the data exploration experience by incorporating dynamic exploration, AI-driven insights, flexible navigation, and customizable appearance. Here's a closer look at the key takeaways from the tutorial:
- Dynamic Exploration: Facilitates the analysis of data by enabling decomposition into chosen dimensions or factors.
- AI Splits: Employs artificial intelligence to automatically segment data, explaining fluctuations or outliers.
- Flexible Navigation: Offers a non-linear navigation through data hierarchies, enhancing the analytical process.
- Customizable Visuals: Allows adaptation of the visual's appearance to align with specific reporting or dashboard needs.
This tool significantly contributes to a deeper understanding of data, enabling users to uncover hidden insights and make informed decisions. The Decomposition Tree visual represents a leap in how data can be visualized and analyzed within Power BI, highlighting the importance of AI in modern data exploration techniques.
Deep Dive into Decomposition Tree Visuals
Exploring data through Power BI's Decomposition Tree visual marks a significant advancement in how businesses can analyze and visualize their datasets. This AI-enhanced tool offers a comprehensive and interactive approach to data exploration, allowing users not only to dissect their data into more manageable chunks but also to understand the underlying factors driving trends and anomalies. The introduction of AI Splits in the tool automatically segments the data, making the analysis even more insightful and less labor-intensive. The interactive nature of the Decomposition Tree, coupled with its ability to customize and adapt to various reporting needs, underscores its utility in a wide range of industries and scenarios. It represents a blend of simplicity and sophistication, providing both novice and advanced users with the capabilities to uncover deep insights within their data. This versatility makes the Decomposition Tree an indispensable part of Power BI's suite of data visualization tools, further enhancing the platform's reputation as a leader in business intelligence solutions.
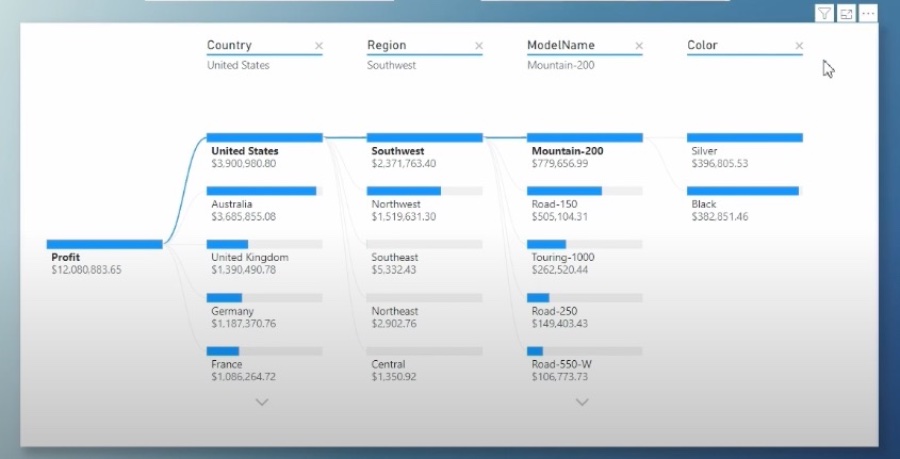
In a recent tutorial on Pragmatic Works' YouTube channel, Angelica highlighted the Decomposition Tree visual in Power BI. This feature allows for detailed data exploration across multiple dimensions. Users can delve into their data, breaking it down into various components to better understand core contributing factors or performance of different segments.
The Decomposition Tree stands out for its dynamic exploration capabilities. It offers users the flexibility to choose and further drill down into the dimensions they find most interesting or relevant. This visual is particularly useful for those looking to explore their data beyond surface-level insights, presenting a clear path to deeper analysis.
One of the standout features of this visual is its use of Artificial Intelligence (AI) to automatically identify and segment data. This AI functionality, known as AI Splits, helps in explaining fluctuations or anomalies within the dataset. It simplifies the process of uncovering underpinning factors influencing data trends.
Moreover, the Decomposition Tree visual is highly responsive to applied filters and able to maintain its responsiveness across varying levels of data hierarchy. This ensures a seamless exploration experience, even when dealing with complex datasets. Flexibility in navigation, both top-down and in reverse, further enhances its utility.
Customization is another key aspect of the Decomposition Tree visual. Users have the freedom to adjust the visual elements of the tree to fit their reporting or dashboard needs. This level of personalization ensures that visual outputs not only convey the intended insights but also adhere to aesthetic preferences or branding requirements.
Ultimately, the Decomposition Tree is a potent tool for those involved in data analysis. Its incorporation into Power BI leverages advanced analytics and intelligence capabilities, making it possible to unearth insights that could go unnoticed with conventional visualizations.

People also ask
How do you use decomposition tree visual in Power BI?
To utilize the decomposition tree visual in Power BI, one initiates by creating a decomposition tree.
Which are the AI visuals offered by Power BI?
Power BI enhances data visualization through AI-driven visuals, including the Decomposition Tree Visual, which allows for detailed breakdowns of measures by various dimensions; the Power BI Q&A Visual, fostering interactive data exploration; and the Power BI Smart Narrative visual, enabling automatic insights narration.
What is the breakdown tree in Power BI?
The breakdown tree, known in Power BI as the decomposition tree visual, serves as a tool to visualize data across diverse dimensions. It facilitates automatic aggregation of data and provides the capability for users to explore dimensions in any desired sequence.
How big is a decomposition tree in Power BI?
In Power BI, decomposition trees have minimal restrictions. They accommodate up to 50 levels and 5,000 data points. However, they do not extend support to on-premise Analysis Services, and features like AI Splits are not available in Azure Analysis Services, Power BI Report Server, or when publishing to the web.
Keywords
Power BI Decomposition Tree, AI Visuals in Power BI, Decomposition Tree Visuals, Power BI AI Features, Analyzing Data in Power BI, Machine Learning Power BI, Advanced Analytics Power BI, Power BI Visualization Techniques