- All of Microsoft
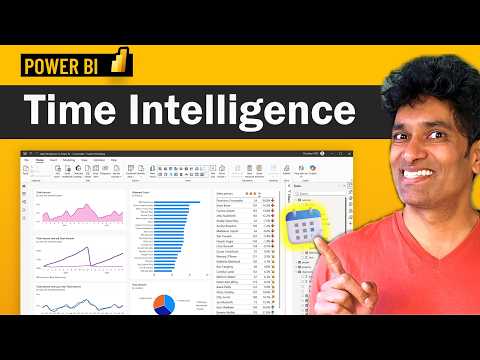
Power BI: 5 Essential Date Concepts
Power BI Date Intelligence: calendar, DAX YTD QTD MTD, MoM and YoY analysis, moving averages, SQL Server
Key insights
- Date Intelligence: This YouTube tutorial shows how to use DAX to track shipment and product trends with clear examples.
It focuses on practical reporting needs and demonstrates moving averages to smooth volatility. - Calendar table: Build a dedicated calendar table with a single date column that has no blanks, covers continuous dates, and spans full years.
That reliable calendar structure makes period comparisons and fiscal-year calculations accurate. - Mark as date table and auto date/time: Mark your calendar table in Power BI so classic time-intelligence functions identify the authoritative date column.
Consider turning off auto date/time and use one central calendar table for consistent modeling. - Time intelligence functions: Use DAX functions like TOTALYTD, SAMEPERIODLASTYEAR, DATEADD and related formulas for YTD, QTD, MTD and period comparisons.
These functions work best when they reference the calendar table’s date column. - Month-over-month comparisons and moving averages: Calculate month-to-month variance and percent change, compare values from “n months ago,” and apply moving averages to reduce noise.
The video shows DAX patterns to implement each of these measures cleanly. - Date slicers and custom fiscal year: Use relative date slicers and date pickers for user-friendly filtering and apply custom year-end logic when your fiscal year differs from the calendar year.
Prefer DAX measures over visual-level calculations for repeatable, model-level date intelligence.
Overview of Chandoo’s Power BI Date Tutorial
In a clear and practical YouTube tutorial, Chandoo walks viewers through essential techniques for working with dates in Power BI, focusing on real business examples. He uses a shipment and product dataset to explain how correct date handling improves trend analysis, seasonal comparisons, and reporting accuracy. Consequently, the video centers on five core ideas that help analysts move from ad hoc time handling to reliable, repeatable calculations. In addition, Chandoo demonstrates smoothing methods such as moving averages to make volatile metrics easier to read.
Moreover, the tutorial balances theory and hands-on steps so viewers can apply the lessons directly to their models. Chandoo highlights common pitfalls and recommends patterns that scale across dashboards and data sizes. Therefore, the content appeals to both new Power BI users and those seeking to refine their date logic. Overall, the video stresses practical outcomes like clearer KPIs and more trustworthy comparisons.
Building and Marking a Reliable Date Table
First, Chandoo emphasizes creating a central date table that contains continuous, unique date values and covers the full reporting range. He explains that missing dates or duplicates will break many built-in functions and make filters behave unpredictably, so a clean calendar is foundational. Then he shows how to mark that table in Power BI so the engine treats it as the authoritative time source.
However, he also notes a recent change in guidance: while marking as a date table remains best practice for classic DAX functions, Power BI’s newer calendar-based features sometimes reduce the need to mark explicitly. For teams, this creates a tradeoff: marking simplifies classic measures and enforces data quality, whereas relying on flexible calendar behavior can speed setup but may complicate advanced DAX. Therefore, Chandoo recommends a deliberate calendar table for robust models and consistent behavior across visuals.
Core Time Intelligence Techniques Explained
Next, the video covers common calculations such as YTD, QTD, MTD, month-to-month variance, and same-period-last-year comparisons. Chandoo uses straightforward DAX examples to show how these measures reference the calendar table and why the structure matters for accuracy. He also contrasts DAX measures with performing similar calculations in visuals, explaining when each approach makes sense.
For example, DAX measures offer reusability and precise control over contexts, while visual-level calculations can be faster for simple ad hoc displays. Yet, there is a tradeoff: complex DAX can be harder to maintain, especially without clear naming and documentation, whereas visual calculations may not persist across reports. Thus, Chandoo advises building key logic as measures while reserving visuals for quick exploration.
Advanced Scenarios and Tradeoffs
Chandoo tackles advanced needs like custom fiscal years, moving averages, and comparing values from “n months ago,” showing practical DAX patterns to handle each case. He points out that custom year ends require careful calendar alignment and sometimes additional columns to tag fiscal periods, which adds complexity but yields accurate financial reporting. Moving averages, meanwhile, smooth noisy series but can mask short-term variation, so Chandoo suggests using them alongside raw values and clear labels.
Furthermore, he explains that comparing across irregular intervals or sparse data raises choices about interpolation and last-known values, and each choice affects business interpretation. Consequently, modelers must weigh clarity, performance, and user expectations when selecting an approach. In short, advanced date intelligence delivers richer insight but demands deliberate decisions about assumptions and tradeoffs.
Implementation Challenges and Best Practices
Finally, Chandoo addresses performance, maintainability, and common errors that practitioners encounter when implementing date logic in Power BI. He recommends turning off hidden automatic hierarchies if you use a central calendar, documenting measures clearly, and testing calculations across edge cases such as leap years or incomplete months. These steps reduce surprises when users filter dashboards or when models scale to larger datasets.
Moreover, he underscores the importance of balancing complexity with transparency: choose DAX constructs that meet analytical needs without making the report opaque to colleagues. In addition, version control for sample files and consistent naming for the date table and measures simplify future changes. Ultimately, Chandoo’s tutorial offers a pragmatic roadmap: build a sturdy calendar, prefer reusable measures, and treat date decisions as design choices that affect both accuracy and usability.

Keywords
Power BI date functions, Power BI date table, Power BI time intelligence, DAX date functions, Power BI date hierarchy, Power BI date slicer, Power BI calendar table, Power BI date formatting