- All of Microsoft

Enhance Teaching: Custom Visuals in Power BI for Educators
Elevate Your Power BI Reports with Custom Visuals - A Must-Watch Guide for Educators!
Key insights
- Introduction to using custom visuals in Power BI to enhance data visualization capabilities and create visually appealing reports.
- Guide to finding and importing custom visuals from the Power BI Visuals Marketplace or directly within Power BI Service or Desktop.
- Steps to effectively use custom visuals in reports, including how to select and configure them for specific datasets.
- Key considerations regarding performance, security, and privacy when choosing custom visuals developed by third parties.
- Troubleshooting advice for common issues such as custom visuals not rendering or data not displaying correctly.
Custom Visuals in Power BI for Educators
Power BI's custom visuals offer a significant opportunity for educators to present data in more engaging and understandable formats. These visuals, created by developers outside the Microsoft team, can be easily imported into Power BI reports, providing educators with a broad array of options to tailor their data presentation to the specific interests and needs of their audience. This adaptability makes Power BI a highly useful tool in educational settings where data can vary widely across different subjects and research projects.
Understanding how to find, import, and utilize these visuals is crucial for educators looking to make the most out of Power BI’s capabilities. The process involves exploring the Power BI Visuals Marketplace for suitable visuals or finding them directly within the Power BI software. Once imported, these visuals can be configured and applied to diverse datasets, enhancing the comprehensibility and appeal of reports.
However, when incorporating custom visuals into reports, it's important to consider factors such as the potential impact on performance, and the security and privacy policies of third-party visuals. Additionally, being prepared to troubleshoot common issues such as rendering problems or data inconsistencies can ensure a smoother experience. Ultimately, custom visuals can significantly enrich the educational value of Power BI reports, making complex data more accessible and engaging for students and colleagues alike.

In the "Power Platform For Educators - Using Custom Visuals In Power BI" video by Pragmatic Works, viewers learn about enhancing their data visualization through custom visuals in Power BI. Custom visuals are external tools developed by the community that can be integrated into Power BI, offering a broader range of charting and reporting options. This video offers a comprehensive guide on how to find, import, and use these visuals to create more engaging and detailed reports.
The video begins by explaining where to find custom visuals. Users can browse the Power BI Visuals Marketplace online or find them directly within the Power BI Service or Desktop. This step ensures users have access to a variety of options to suit different data presentation needs.
Importing these visuals into Power BI involves a few simple steps, differing slightly between the desktop version and the online service. The aim is to seamlessly integrate these visuals into users' reports, enhancing their visual data representation capabilities without disrupting their existing workflow.
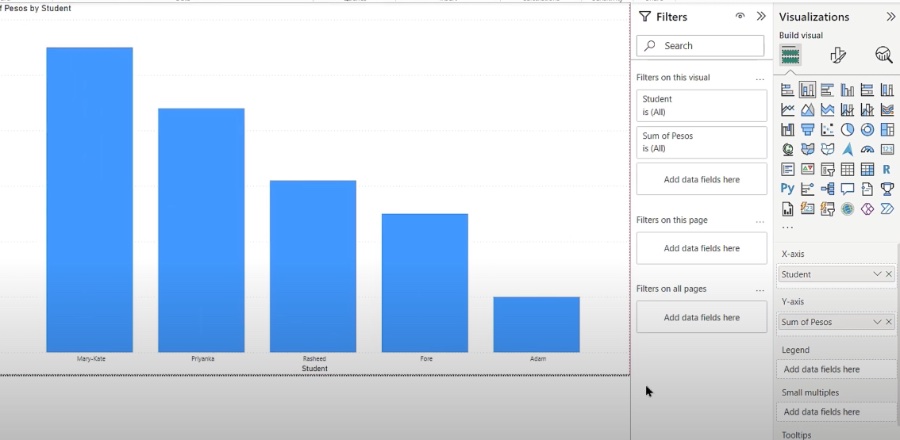
Once imported, the custom visual is ready to be used just like any standard visual within Power BI. Users can drag and drop their data fields to the custom visual, adjusting it to their reporting needs. However, it's important to note that configuration might vary based on the capabilities of the custom visual chosen.
Best practices and considerations are highlighted, emphasizing the importance of performance testing, evaluating security and privacy policies, and understanding the support and updates landscape for custom visuals. These guidelines ensure users can make informed decisions when selecting and implementing these tools.
![]()
People also ask
How do I use custom visuals in Power BI?
Importation of custom visuals not officially recognized by Microsoft should be performed only with trusted sources to maintain the integrity and security of your Power BI reports.
Do you need to import custom visuals each time you want to use them when you are developing a new report in Power BI?
Each new report development in Power BI necessitates the re-importation of custom visuals from the AppSource to ensure the latest features and compatibilities are utilized.
What is the difference between power platform and Power BI?
Microsoft differentiates its suite by focusing Power BI on superior data analysis and visualization capabilities, while Power Platform serves as an integrated solution for application development, workflow automation, and advanced chatbot functionalities, catering to a broader range of business needs.
How do I make visuals interactive in Power BI?
To enhance the dynamism of your Power BI reports, activating the visual interaction controls is essential.
Keywords
Power Platform education, Power BI customization, custom visuals Power BI, educators Power BI, Power Platform teaching, Power BI visualizations, educational data analysis, interactive learning Power BI