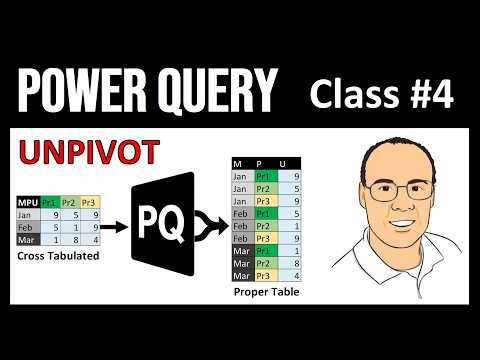
Power Query: Unpivot Crosstab to Table
Microsoft expert guide to Power Query unpivoting in Excel and Power BI Desktop for clean data and M code tips
Key insights
- Goal: The video demonstrates how to convert a Cross Tab (matrix-style) table into a clean, tabular layout using Power Query’s Unpivot tools so each observation becomes a single row for reliable analysis.
- Prepare data: Turn the source range into an Excel Table, then load it into the Power Query Editor (the video uses the Excel.CurrentWorkbook method) so the query can refresh automatically when source data changes.
- Unpivot methods: Choose between manual selection (Unpivot Columns) or keeping key fields and using Unpivot Other Columns to convert every other column into attribute-value pairs; this handles new columns more robustly.
- M code and functions: Power Query exposes the operation as the Table.UnpivotOtherColumns function; the presenter edits the formula bar to rename fields and uses the Advanced Editor with a let expression to make steps repeatable and clear.
- Examples shown: Example 1 covers one row and one column header; Example 2 shows two column headers and one row header; Example 3 demonstrates the same unpivot workflow inside Power BI Desktop (including turning off “Enable Load” when appropriate).
- Result and benefits: The unpivot creates two key fields—Attribute (former column headers) and Value (the numbers); you then Close & Load to Excel or use the query output in PivotTables, charts, or Power BI for easier filtering, grouping, refreshes, and less manual cleanup.
Overview of the video
In a recent YouTube tutorial, ExcelIsFun’s Mike Girvin demonstrates how to convert crosstab data into a usable table by using Power Query’s Unpivot feature. The video targets analysts who repeatedly face wide, matrix-like worksheets and need a reliable way to normalize them for analysis. Furthermore, the presenter outlines a course plan and uses clear step-by-step examples to show how unpivoting works in both Excel and Power BI Desktop. As a result, viewers get a practical walkthrough rather than only conceptual guidance.
Step-by-step demonstrations
First, Girvin shows how to take a simple crosstab with one row header and one column header and turn it into a tidy table. He converts the range into an Excel Table, then brings it into the Power Query Editor and applies the Unpivot operation to transform month columns into an Attribute column and their values into a Value column. Next, he repeats the technique on a slightly more complex layout that contains two column headers and one row header, demonstrating how to preserve identifiers while reshaping the rest. Consequently, viewers see how the same core steps adapt to different layouts.
Key functions and M code explained
Throughout the tutorial, the video highlights specific functions such as Excel.CurrentWorkbook and the M function Table.UnpivotOtherColumns. Girvin edits the M code in the formula bar and shows the Advanced Editor to explain the let expression and how query steps form a reproducible script. He also emphasizes renaming columns and listing values in the second argument of the unpivot function to control which columns remain as identifiers. Therefore, the segment helps learners understand how the GUI actions map to underlying code.
Differences between Excel and Power BI
Importantly, the video contrasts how unpivoting behaves in Excel versus Power BI Desktop, noting subtle workflow differences. In Power BI, Girvin points out the need to uncheck Enable Load when a query should be used only as a staging step, and he shows how the editor and data model interact. Moreover, the presentation clarifies that while the M code is largely the same, the environment and subsequent steps such as data model refresh and visual creation differ. Thus, users who switch platforms can anticipate and plan for these distinctions.
Tradeoffs and practical challenges
Although Unpivot is powerful, the video also highlights tradeoffs that analysts must manage when reshaping data. For instance, automatic unpivoting can break if source headers change shape unexpectedly, so relying solely on GUI steps without understanding M code can reduce resilience in production workflows. Similarly, keeping a few columns unpivoted with Table.UnpivotOtherColumns simplifies maintenance when new period columns appear, yet it may require careful naming conventions to avoid accidental inclusion of metadata columns. In short, balancing flexibility and robustness requires judgement and occasional manual checks.
Performance and maintenance considerations
Mike Girvin addresses performance and maintenance by encouraging users to design queries that tolerate new columns and to review generated M code periodically. He demonstrates how the query output can feed a PivotTable or chart, and he suggests testing refresh behavior when source files are updated. However, large data sets or complex transformations can slow refresh times, so some tradeoffs between pre-processing in the source system and doing work in Power Query will be necessary. Consequently, teams should measure performance and choose where to optimize first.
Teaching approach and accessibility
The video’s teaching style pairs screenshare steps with pauses to inspect the M code, which helps learners see both the action and the result. Additionally, the tutorial includes subtitles and translations in many languages, improving accessibility for a global audience. Because the presenter provides downloadable sample files and shows how to follow along, viewers can practice and reproduce the outcomes on their own machines. Therefore, the format suits both beginners and intermediate users who want hands-on experience.
Implications for analysts and teams
For analysts, mastering unpivoting reduces repetitive manual cleanup and improves the quality of downstream analysis in PivotTables and BI tools. Teams gain repeatable processes that simplify reporting and support refreshable models, but they must invest time to document queries and test edge cases. Moreover, embracing M code helps with automation, yet it raises a mild learning curve for staff who are used to manual edits. Ultimately, the benefits often outweigh the initial effort for recurring data tasks.
Takeaways and next steps
In conclusion, ExcelIsFun’s video provides a clear, practical path for converting crosstab data into a normalized format using Power Query’s Unpivot capabilities. Viewers learn not only the GUI steps but also the core M functions that make transformations repeatable and robust. As a next step, teams should apply the method to their real files, inspect the M code, and plan for performance tuning when datasets grow. Overall, the video serves as a useful bridge from spreadsheet cleanup to sustainable data preparation workflows.

Keywords
Power Query unpivot, Unpivot crosstab to tabular, Convert crosstab to table Power Query, Power Query unpivot columns, Excel Power Query crosstab conversion, Transform crosstab to tabular format, Unpivot multiple columns Power Query, Power Query unpivot tutorial