Data Analytics
- All of Microsoft
Timespan
explore our new search
Power BI
Jun 20, 2025 2:19 AM
Power BI Tips: Switch Between Absolute and Percentage Views Fast
by HubSite 365 about How to Power BI
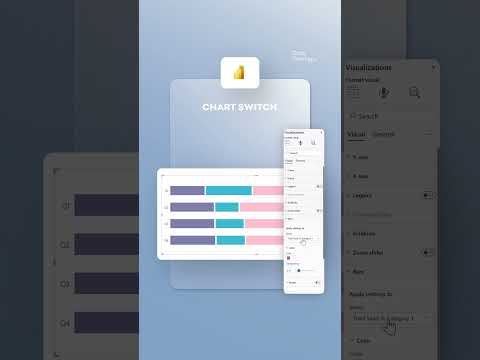
Power BI effortlessly toggles between absolute and percentage values enhancing data visualization and insights.
Key insights
- Power BI lets users easily switch between viewing data as absolute values (raw numbers) and percentage values (proportions of totals). This feature helps users compare actual numbers or see the share each category contributes to the whole.
- The switching is made possible by using Field Parameters, which allow viewers to choose the display type, and DAX’s SWITCH function, which changes the calculation based on user selection.
- This dynamic approach improves the User Experience: viewers can change data views with a click, without needing multiple visuals or report pages. It also saves space and keeps dashboards clean.
- Customizability is a key benefit. Users can define their own logic for percentage calculations, such as showing percentages of grand totals, column totals, or row totals to fit business needs.
- Simplified Maintenance: Since only one set of visuals and measures is needed, any updates automatically apply to all views. This reduces time spent managing reports.
- Recent innovations: The introduction of Field Parameters and interactive slicers/buttons makes toggling between absolute and percentage values more intuitive and self-service. Advanced users can use Calculation Groups for even more flexibility in dynamic reporting.
Keywords
Power BI toggle absolute percentage Power BI value switch Power BI data visualization tips Power BI measure formatting Power BI dynamic labels Power BI report interactivity Power BI dashboard tricks