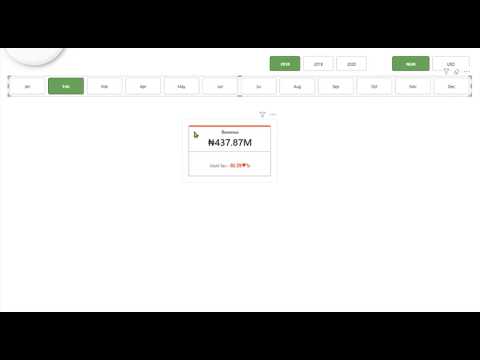
Power BI New Card Visual Quick Guide
Master Power BI New Card Visual to build cleaner interactive reports and unlock deeper insights with Microsoft Power BI.
Key insights
- YouTube tutorial summary: This video explains the New Card visual in Power BI and why reporters and analysts should use it for headline metrics.
It highlights practical examples like revenue, customer counts, and growth figures. - What it is: The Card visual displays compact, customizable KPI cards that can show several metrics in one container.
Each card can include a main value, a label, supporting details, and an optional image. - Key features: Supports multiple metrics per visual, flexible layouts (grid, horizontal, vertical), hero images, and conditional formatting.
These features make dashboards more compact and easier to scan. - Design and formatting: The visual uses the modern format pane for consistent styling across reports.
Control spacing, order, and typography to improve readability and alignment with themes. - Practical benefits: Microsoft now recommends the new Card visual as the standard because it replaces legacy visuals for new reports, improves design consistency, and reduces the need for many separate KPI visuals.
Existing legacy cards keep working but consider migrating for new builds. - Quick how-to: Open Power BI Desktop, load your dataset, add measures (for example total sales or growth), insert the Card visual, then configure values, labels, images, and conditional formatting to match report needs.
Use grouping and layout options to keep dashboards clean and actionable.
In a recent YouTube tutorial, UrBizEdge offers a concise walkthrough of the New Card Visual in Power BI, showing how the modern card can create cleaner and more interactive reports. The video positions the visual as the preferred option for headline metrics, explaining how it consolidates multiple values, supports images, and provides flexible layout controls. Consequently, report authors can present key performance indicators more compactly while keeping context and visual clarity. This article summarizes the tutorial, highlights practical steps, and examines the tradeoffs teams face when adopting the new visual.
Overview of the New Card Visual
UrBizEdge explains that the Card visual replaces legacy card visuals for new reports and is now the standard component for KPI display. The visual brings together multiple cards within a single container, allowing each card to show a main value, a supporting label, reference context, and an optional image. As a result, designers can reduce the number of separate visuals on a page and improve dashboard scan-ability without losing important detail.
Moreover, the tutorial notes that Microsoft updated default styling to improve spacing and readability, which promotes a consistent look across reports. UrBizEdge points out that existing reports with legacy cards continue to function, yet new developments should favor the modern card to benefit from the richer formatting and layout options. Therefore, organizations planning report refreshes should consider a gradual shift toward the modern card visual.
Key Features Demonstrated
The video highlights several practical features, including the ability to show multiple metrics in one container and to choose between grid, horizontal, and vertical layouts. UrBizEdge demonstrates adding labels and reference values, which help frame the main metric with context such as year-over-year change or budget comparisons. In addition, hero images can be attached to cards from local files, URLs, or data columns to provide visual anchors like product photos or regional flags.
Conditional formatting and a modern format pane receive particular attention, since they let authors control colors, fonts, and spacing in a familiar interface. The presenter also shows customizing display order and spacing so cards fit cleanly in limited page real estate. As a result, the visual supports more polished dashboards that stay consistent with other updated Power BI elements.
Tutorial Steps and Practical Workflow
UrBizEdge walks through a simple workflow: open Power BI Desktop, load a dataset, create measures, and then drop those measures into the card visual fields. From there, the presenter configures layout, adds labels, and applies conditional formatting to call attention to important thresholds. He encourages trying different layout modes to see how metrics respond to resizing and to ensure readability across devices.
While the tutorial is compact, it emphasizes testing visuals with real data and realistic screen sizes before publishing. The creator also briefly mentions that sample files accompany the lesson for hands-on practice, allowing users to replicate steps and experiment with layout and formatting. Thus, the video serves as a quick start that balances instruction with opportunities to learn through doing.
Tradeoffs and Implementation Challenges
Although the new card visual provides clear benefits, UrBizEdge discusses tradeoffs that report designers must weigh. For example, packing multiple metrics into one visual conserves space but can introduce visual clutter if too many elements compete for attention. Consequently, teams must decide whether compactness or single-metric focus better serves end users, and this decision often depends on the audience and the dashboard’s purpose.
Performance and accessibility also present challenges. Adding images and complex conditional formatting may slightly increase rendering time, especially in large reports or when visuals pull images from external sources. Likewise, designers must ensure that compact cards remain readable for users with visual impairments by using sufficient contrast, clear labels, and accessible font sizes. Therefore, balancing aesthetics, interactivity, and performance requires deliberate testing and iteration.
Practical Recommendations and Conclusion
UrBizEdge recommends adopting the modern Card visual for new reports while migrating legacy cards selectively to avoid disruption. He suggests using hero images sparingly, prioritizing clear labels and context, and testing the visual on multiple screen sizes to confirm legibility. Furthermore, teams should leverage conditional formatting to surface important changes but document color rules to avoid misinterpretation.
In conclusion, the YouTube tutorial provides a useful, hands-on guide to the new card visual and outlines pragmatic steps for implementation. While the visual improves compactness and design consistency, adopting it well requires careful tradeoffs between clarity, performance, and accessibility. Ultimately, UrBizEdge’s walkthrough offers a practical starting point for report authors who want to modernize KPI displays in Power BI.

Keywords
power bi card visual tutorial, how to use card visual in power bi, power bi new card visual, power bi card formatting tutorial, power bi KPI card visual, power bi card visual tips, custom card visuals power bi, power bi card visual examples