- All of Microsoft

How to easy Power Automate: Guide to Sum, Count & Group
Power Platform Cloud Solutions Architect @ Microsoft | Microsoft BizApps MVP 2023 | Power Platform | SharePoint | Teams
Master Power Automate: Effortlessly Sum, Count & Group Data in Minutes!
Key insights
Quick, Efficient Data Processing in Power Automate: Learn to effectively group, count, and sum data in Power Automate. This guide showcases how to use select and convert functions for handling large arrays from sources like SharePoint, optimizing the process with only 7 actions and api calls. No complex iterations required.
- Utilize Group By action for organizing data based on one or more columns, enabling aggregation functions like Sum, Count, Average, Minimum, and Maximum to analyze data efficiently.
- Summary and Count actions further allow for summarization and item counting within tables or arrays, enhancing data analysis capabilities.
- Learn how to add new columns with aggregated values to your data, improving data insights and reporting.
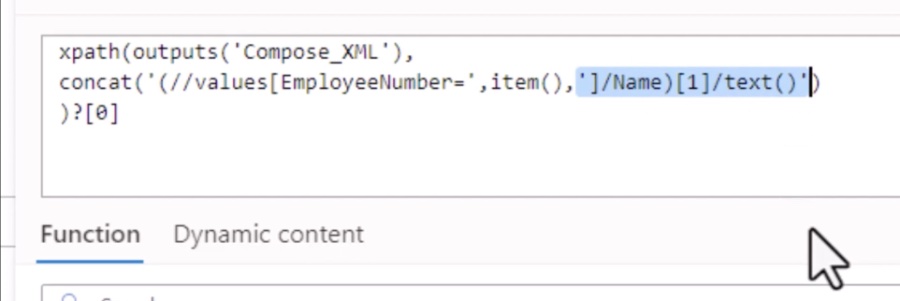
- Illustrates how to use xpather.com for writing and testing XPath expressions, aiding in complex data aggregation scenarios.
- A step-by-step example is provided to demonstrate the calculation of total sales per product, offering a practical application of grouping and summarizing actions.
Exploring Power Automate's Data Handling Abilities
Power Automate excels in automating and optimizing data processing tasks, making it an invaluable tool for businesses and individuals who manage data regularly. Its ability to efficiently group, count, and sum data from various sources like SharePoint significantly reduces the time and complexity involved in data manipulation. Through the utilization of actions such as Group By, Add Columns, Summary, and Count, users can transform raw data into meaningful insights with minimal effort.
The platform's support for XPath expressions and online tools like xpather.com also opens up avenues for handling more complex data scenarios, allowing for advanced data analysis and reporting functionalities. The integration of these features, alongside the ability to add new columns with aggregated values, enriches the user's ability to understand and utilize their data fully.
With just a few actions, Power Automate enables the automation of intricate data aggregation processes, demonstrating its powerful capabilities in data handling. Whether for summarizing sales data, counting items in an inventory, or any other data-driven requirement, Power Automate streamlines these tasks, ensuring accuracy and efficiency. Its straightforward approach, as detailed in the example provided, illustrates how users can leverage Power Automate to enhance their data processing workflows, ultimately contributing to better decision-making and productivity.
In a recent YouTube video by Damien Bird [MVP], viewers are taught how to efficiently use Power Automate to group by, count, and sum values from a data source like SharePoint. The method involves selecting distinct values and converting JSON data into XML. The video also introduces a free online tool, xpather.com, for writing and testing XPath expressions, enabling viewers to handle complex data aggregation scenarios in Power Automate Cloud Flow without needing multiple actions or API calls.
Grouping, summarizing, and counting data is presented as essential for analyzing and manipulating data within Power Automate. The video outlines steps for using the Group By and Add Columns actions to group data based on criteria, followed by using Summary and Count actions to process values within each group. These features allow for advanced data manipulation with minimal effort.
The Group By action is detailed with steps to group data in a table based on specified columns, offering options to aggregate values using functions like Sum, Count, and Average. Similarly, the Summary and Count actions provide a way to summarize or calculate the number of items in a table or array. The video emphasizes the ease of adding and operating on new columns within grouped data.
An example showcases how to calculate total sales for each product using the described actions. This involves grouping the sales data by product, adding a new column for total sales, and then summarizing the data to find the total sales for all products. This practical example highlights the potential of Power Automate for efficient data analysis and manipulation.
Further Insights into Power Automate
Power Automate, also known as Microsoft Flow, is a powerful tool designed to automate workflows across various applications and services. It enables users to create automated processes that trigger specific actions based on certain conditions, making repetitive tasks more manageable and freeing up time for more important work. The platform supports a wide range of applications, from Microsoft products like SharePoint, Excel, and Teams, to third-party services such as Twitter, Dropbox, and Google Drive.
With its intuitive graphical interface, Power Automate allows users to easily design workflows without the need for extensive programming knowledge. Users can select from a library of pre-built templates or create custom flows that fit their unique requirements. Whether it’s automating notifications, synchronizing files across applications, collecting data, or processing forms, this tool caters to a broad spectrum of automation needs.
Group By Action
- Add a Group By action to your flow.
- Select the table or array that contains the data you want to group.
- In the "Group by" field, select the columns you want to group by. You can select multiple columns by holding down Ctrl or Shift while selecting them.
- If you want to aggregate the values in each group, select the "Aggregate" checkbox.
- In the "Aggregate with" field, select the aggregation function you want to use. The available aggregation functions include Sum, Count, Average, Minimum, and Maximum.
- If you want to add new columns to the grouped data, select the "Add columns" checkbox.
- In the "New column name" field, enter a name for the new column.
- In the "Operation" field, select the operation you want to perform. The available operations include Sum, Count, Average, Minimum, and Maximum.
- In the "Column" field, select the column you want to operate on.
Summary Action
- Add a Summary action to your flow.
- Select the table or array that contains the data you want to summarize.
- In the "Column" field, select the column you want to summarize.
- In the "Aggregation function" field, select the aggregation function you want to use. The available aggregation functions include Sum, Count, Average, Minimum, and Maximum.
- If you want to add the summary value to the table, select the "Add to table" checkbox.
Count Action
- Add a Count action to your flow.
- Select the table or array that contains the data you want to count.
- If you want to add the count value to the table, select the "Add to table" checkbox.

People also ask
Is there a quick way to sum in Excel?
Answer: To quickly sum up numbers in Excel, navigate to the cell adjacent to the numbers you wish to sum, select AutoSum from the Home tab, press Enter, and the operation is complete. AutoSum automatically inputs a formula using the SUM function to execute the sum of the numbers.
What is the formula for count sum?
Answer: The COUNT function is used to determine the number of non-empty cells within a specified range, utilizing the syntax =COUNT(cell range). Conversely, the SUM function calculates the total of a specified cell range, with its syntax being =SUM(cell range).
How do you quick sum selected cells in Excel?
Answer: To quickly sum selected cells in Excel, simultaneously press the Alt key and the equals sign (=) on your keyboard. This action introduces the SUM function to the selected cell and automatically chooses adjacent cells for the sum operation. Conclude by pressing Enter to reveal the sum.
What is the sum Countif function in Excel?
Answer: In Excel, COUNTIFS assesses specified criteria across multiple ranges and counts occurrences that meet all specified criteria. SUMIFS, in contrast, sums up the values in a range that satisfy multiple criteria.
Keywords
Power Automate Guide, Quick Sum Tutorial, Count in Power Automate, Grouping with Power Automate, Excel Automation Techniques, Power Automate Tips, Automate Data Processing, Microsoft Flow Sum Function, Efficient Counting Power Automate, Learn Power Automate Quickly