- All of Microsoft
Excel: 7 Functions for Live Forecasts
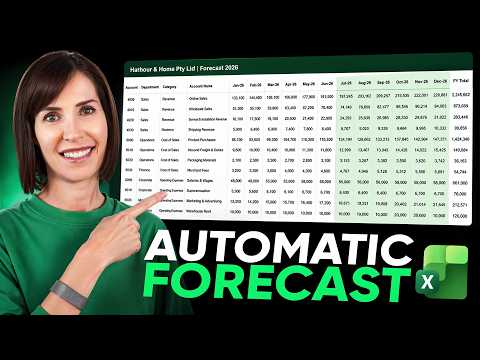
Microsoft Excel guide to dynamic per account forecasting that auto updates with FORECAST.LINEAR XLOOKUP LET and FILTER
Key insights
- Dynamic forecasting: Build a forecast that updates itself by using different methods for each account and a single Actual/Forecast flag on row 3; paste next month’s actuals, flip the flag, and all formulas recalculate automatically.
- Key functions: The model uses FORECAST.LINEAR, FILTER, LET, XLOOKUP, and TAKE to shape each account’s logic and keep formulas compact and readable.
- Account-specific methods: Apply a 3% growth rate for online sales, linear trends for wholesale and some costs, ratios tied to sales or purchases for fees and shipping, budget lookups for salaries and rent, a three-month average for subscriptions, and repeat-last-quarter for quarterly spikes.
- Outlier handling and averages: Use FILTER with logical tests to exclude a single outlier month or to average only actual months, so one odd month cannot skew the whole forecast.
- Named formula and audit caution: Replace repeated logical tests with a named formula like status to update many formulas at once, but note that names in the Name Manager can be harder for colleagues to audit.
- Compatibility and benefit: Built for Microsoft 365 (works in practice with automatic recalculation); most functions work in Excel 2021 too but TAKE is not available there, so use an alternate three-month average method; overall this reduces manual edits and supports rolling forecasts.
Overview
Mynda Treacy (MyOnlineTrainingHub) [MVP] demonstrates a practical Excel workflow in her YouTube video that builds a rolling forecast that updates itself when new actuals are added. She argues that a one-size-fits-all trend line often fails because different accounts behave differently, so she applies a mix of methods chosen for each row. The result is a workbook where past months are marked as Actual or Forecast, and every formula only uses the months flagged as actual to drive projections for the future.
How the Forecast Is Structured
The sheet relies on a simple but powerful convention: a single status row flags months as Actual or Forecast, and every formula filters on that flag. Consequently, past values feed the calculation and the same formulas remain intact when you paste next month’s results and flip the flag. This approach makes the workbook a true rolling forecast rather than a series of manual recalculations.
Key Techniques and Functions Used
Treacy mixes several Excel tools so each account gets the method that best matches its behavior. For linear growth she uses a fixed month-on-month percentage, while trend lines use FORECAST.LINEAR wrapped with FILTER so only actual months feed the trend calculation, and ratios to sales or purchases come from historical relationships rather than hard-coded percentages.
Other practical formulas include pulling fixed budget values with XLOOKUP, smoothing short-term variability with a three-month average built from LET, FILTER and TAKE, and computing averages that exclude a one-off outlier by multiplying logical tests inside FILTER. She also repeats the same month from the prior quarter for accounts that spike quarterly. These choices show how combining modern dynamic array functions with traditional logic produces more sensible forecasts across many account types.
Tradeoffs: Flexibility Versus Maintainability
Using many tailored methods improves accuracy but increases workbook complexity, which can make maintenance and auditing harder. For example, Treacy simplifies repeated logical tests with a named formula called status and uses find-and-replace to insert it across many formulas, yet she warns that hiding logic in the Name Manager can make the file harder for a colleague to audit.
Moreover, choosing dynamic array functions such as TAKE gives elegant, compact solutions in Microsoft 365, but it reduces backward compatibility because TAKE is not available in Excel 2021. Therefore teams must balance the benefit of cleaner formulas against the need to support older Excel versions or to hand the file to others who may not have the same environment.
Challenges and Practical Considerations
One challenge is dealing with outliers and shifting relationships: ratio-based forecasts assume the past ratio to sales or purchases remains stable, which may not hold after sudden price changes or structural business shifts. Similarly, linear trends can be dragged by one odd month unless the formulas deliberately exclude it or use robust averaging, so modelers must choose methods that reflect the business reality rather than the simplest mathematical fit.
Performance is another concern when many rows use volatile formulas like FILTER across long timelines; recalculation can slow down large workbooks. Finally, automation increases the chance that an input error propagates quickly, so teams should pair automated recalculation with clear version control, input checks, and documented assumptions so forecasts remain trustworthy.
Recommendations and Next Steps
The video offers clear, actionable techniques for finance teams that want a rolling forecast without rewriting formulas every month. As a next step, teams should document which method each account uses, keep formulas visible where auditors need them, and test the workbook in the lowest common Excel version they support to ensure compatibility.
In short, Mynda Treacy’s walkthrough shows how blending functions like FORECAST.LINEAR, FILTER, LET and XLOOKUP can produce a flexible, updating forecast. However, users must weigh accuracy gains against complexity, compatibility, and auditability to create a solution that works reliably in their environment.

Keywords
Excel dynamic forecasting, Excel forecast functions, FORECAST.ETS Excel tutorial, automatic forecasting in Excel, Excel predictive analytics, rolling forecast Excel formula, Excel time series forecasting, Excel dynamic forecast formulas