Power Apps: build a sample hedge desk dashboard
Welcome to the channel dedicated to #PowerBIDesign and #DAX tutorials! Join us as we explore the world of data visualization, guiding you through the process of creating stunning dashboards
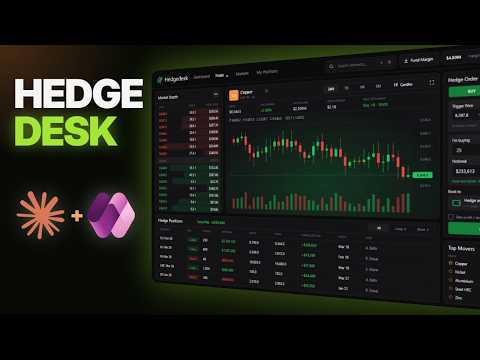
Power Apps makers can assemble a tablet-sized hedge desk with sample prices, market visuals, order sizing, and approval-only orders.
Key insights
- The dashboard is a Power Apps canvas app designed for a 1366-by-768 tablet layout.
- Prices, positions, and order-book data are sample data stored in collections inside the app.
- The order ticket calculates notional by multiplying tonnes by price.
- Sending an order adds it to the app's positions collection; it does not execute a trade.
- Claude Code builds the interface from prompts, which are pasted into Power Apps Studio.
Power Apps can host a prototype hedge desk dashboard that brings sample market data, order sizing, and positions into one tablet-sized canvas app. It is aimed at makers and procurement or trading teams that want to explore a visual workflow without placing real trades. Power BI Professionals demonstrates a Claude Code-assisted build, with prompts pasted into Power Apps Studio.
What it does
The example is a canvas app for a fictional manufacturer's procurement hedge desk. Its stated purpose is to help a buying team view sample metal prices and prepare an order for desk approval; it is not connected to a trading system. A hedge, in this context, is an agreement intended to lock in a future purchase price and reduce exposure to price movements.
The app layout groups several desk functions together: market depth for the selected metal, a price chart, top movers, an order ticket, and a positions table. Market depth lists sample buy and sell prices with bars representing the quantity waiting at each price. The spread is the gap between the lowest displayed sell price and the highest displayed buy price.
The chart has four time-range controls—24H, 7D, 1M, and 6M—and a switch between candlesticks and a line chart. Candlesticks show open, close, high, and low values for a period. The top movers section ranks five metals by their daily movement; selecting one changes the metal shown in both the chart and market depth.
Who it is for and what you need
This is a starting point for Power Apps makers who want to build or adapt a canvas app for an internal business workflow. It is also a useful interface concept for procurement teams that need to review sample prices, estimate order size, and route a proposed order for human approval. The demonstrated layout is specified for a tablet at 1366 by 768.
The build uses Claude Code to generate app content from prompts, then pastes that content into Power Apps Studio. The description identifies the app as using Power Apps only, with no connectors. Its sample prices, order book, and positions are held in collections inside the app, rather than supplied by a live market-data feed or external trading platform.
The example does not depend on a live data connection to demonstrate the interface. Its safety boundaries are part of the initial specification: prices are samples, and orders go only to a desk for approval. That distinction matters if you adapt the design, because the displayed values and positions are illustrative rather than operational market information.
How it works
- Define the app and its limits. Start with a prompt describing a tablet canvas app, the metals to include, the visual theme, and the interface components. The example names copper, aluminum, nickel, steel, and zinc. It also directs the build to use sample prices and send orders only for approval.
- Build the navigation and market depth. Add the top navigation, contract search, margin display, and selected-metal market depth. The depth bars visualize the quantity associated with each sample price, while the price colors distinguish buy and sell sides.
- Add the chart and movers. Include the time ranges, candlestick/line switch, volume bars, last-price display, and top movers. Selecting a mover updates the chart and market depth together so the dashboard follows the chosen metal.
- Add order entry and positions. The ticket accepts Buy or Sell, a price, tonnes, and an account. Notional is calculated as tonnes multiplied by price. The send action uses Collect to add a row to the positions collection; the Long and Short tabs show positions by direction.
- Preview the workflow. In the demonstrated test, the maker selects aluminum, enters 120 tonnes, and sends a buy order. The resulting position appears as a long hedge waiting for desk approval. Preview is used to test the interface, not to submit a real trade.
Power Apps documentation covers pasting code in canvas app code view and the Power Apps YAML format. Those references are relevant when following a code-assisted build, but the app’s safety and data behavior still depend on how its formulas and data sources are configured.
Limitations and alternatives
The key limitation is that this is a self-contained sample app, not a live trading or market-data solution. The prices, positions, and order book are sample values held in app collections. The order action adds a row to the app; it does not send an order to a broker or execute a trade. The fictional desk’s displayed performance is also an illustrative figure, not evidence of actual trading results.
Before adapting the design, verify which data is sample data and where it is stored, and make the approval boundary visible to users. A collection-based prototype is suitable for demonstrating layout and interactions, but live business use would require decisions about data sources, permissions, validation, and the actual approval process. Those elements are not part of the demonstrated no-connector app.
Keep the risk controls in the app specification and test both order directions and position views in Preview. The example’s order ticket calculates notional and shows how much of a stated desk limit an order would use, but those figures remain part of the sample experience. Treat the app as a prototype for workflow discussion, not as trading advice or an execution tool.
Sources
- Microsoft Learn: Paste code into Power Apps canvas app code view
- Microsoft Learn: Power Apps YAML
- Power BI Professionals: Claude-built hedge desk dashboard demonstration
Frequently asked questions
Does the Power Apps hedge desk dashboard place real trades?
No. The example uses sample data, and its Send action adds a row to the app's positions collection for desk approval. It does not execute a trade.
What does the hedge desk order ticket calculate?
It calculates notional by multiplying the entered tonnes by the price. The example also displays how much of the desk's stated limit the order would use.
Where does the sample hedge desk app store its data?
The sample prices, positions, and order book are kept in collections inside the app. The described build uses no connectors.
How does selecting a metal update the dashboard?
Selecting a metal in Top Movers changes the selected metal in both the chart and market depth.