
Step-by-Step: Building Charts in SharePoint Using JSON Magic
Lead Consultant at Quisitive
Unlock SharePoints Chart Magic with Easy JSON Formatting Techniques!
Step-by-Step: Building Charts in SharePoint Using JSON Magic In today's video, we're diving into the exciting realm of SharePoint, unlocking a powerful feature that will take your data visualization to the next level: Bar Charts using JSON formatting.
What You'll Learn:
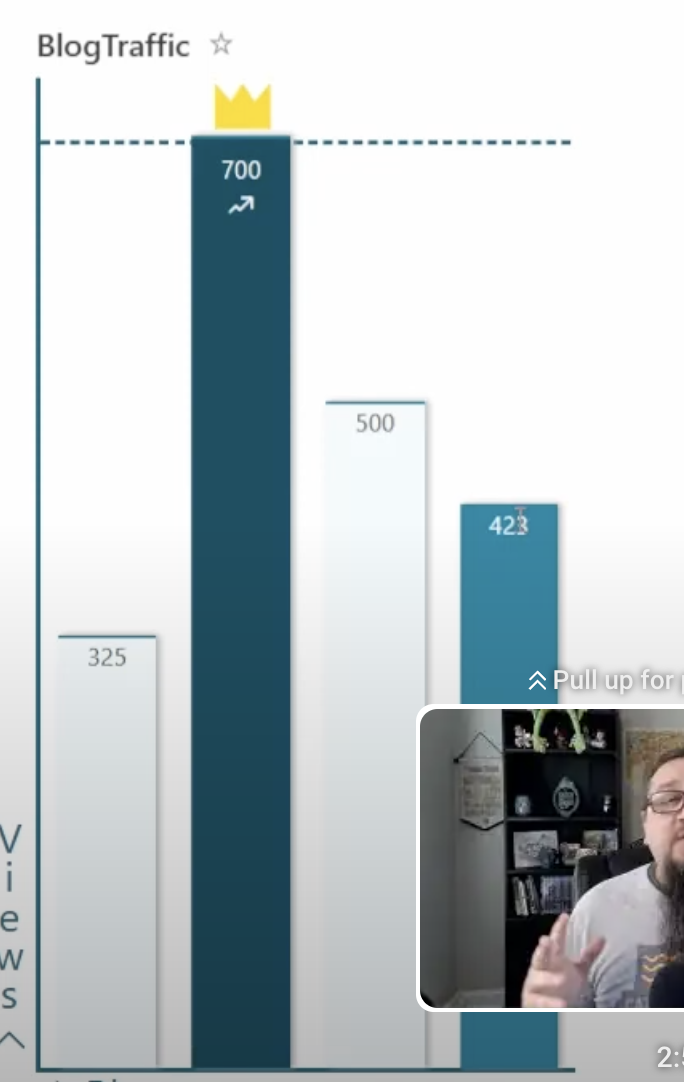
- How to create stunning bar charts directly in SharePoint.
- Step-by-step guide to using JSON formatting for dynamic visuals.
- Tips and tricks for customization to suit your unique needs.
Data visualization doesn't have to be complicated, and with the insights in this video, you'll be crafting professional-looking bar charts in no time.
Why JSON Formatting? JSON isn't just for developers. We'll demystify the process, making it accessible for everyone. From enhancing your reports to impressing your colleagues, mastering this skill will undoubtedly set you apart.
Prepare to embark on a journey that elevates motivation and nurtures a culture of recognition within your organization. Discover the limitless possibilities as JSON list formatting transforms the way you acknowledge employee achievements. Wave goodbye to the ordinary and embrace a new era of appreciation, where the fusion of technology and heartfelt recognition takes center stage.
Our step-by-step walkthrough takes you by the hand, making system implementation a breeze, whether you're a seasoned admin or taking your first steps in SharePoint Online. Watch as JSON list formatting empowers you to craft personalized shoutout templates, showcase accomplishments dynamically, and turn every recognition into a masterpiece.
Don't let your organization miss out on this revolution in celebrating success. Elevate employee recognition with the prowess of JSON list formatting – because every shoutout deserves a touch of extraordinary!
Further Insights on SharePoint Data Visualization
Data visualization in SharePoint Online goes beyond simple chart creation. It encompasses a variety of features that allow organizations to represent data in a visually impactful way, making it easier to understand and analyze. With SharePoint Online, users can create not just bar charts, but also pie charts, line graphs, and more, utilizing the flexibility of JSON scripting to tailor their data representations to specific requirements. This not only makes reports more engaging but also aids in faster decision-making. Tools like SharePoint Online provide an interactive platform for users to experiment with data, offering a user-friendly interface to achieve professional-grade data visualizations.

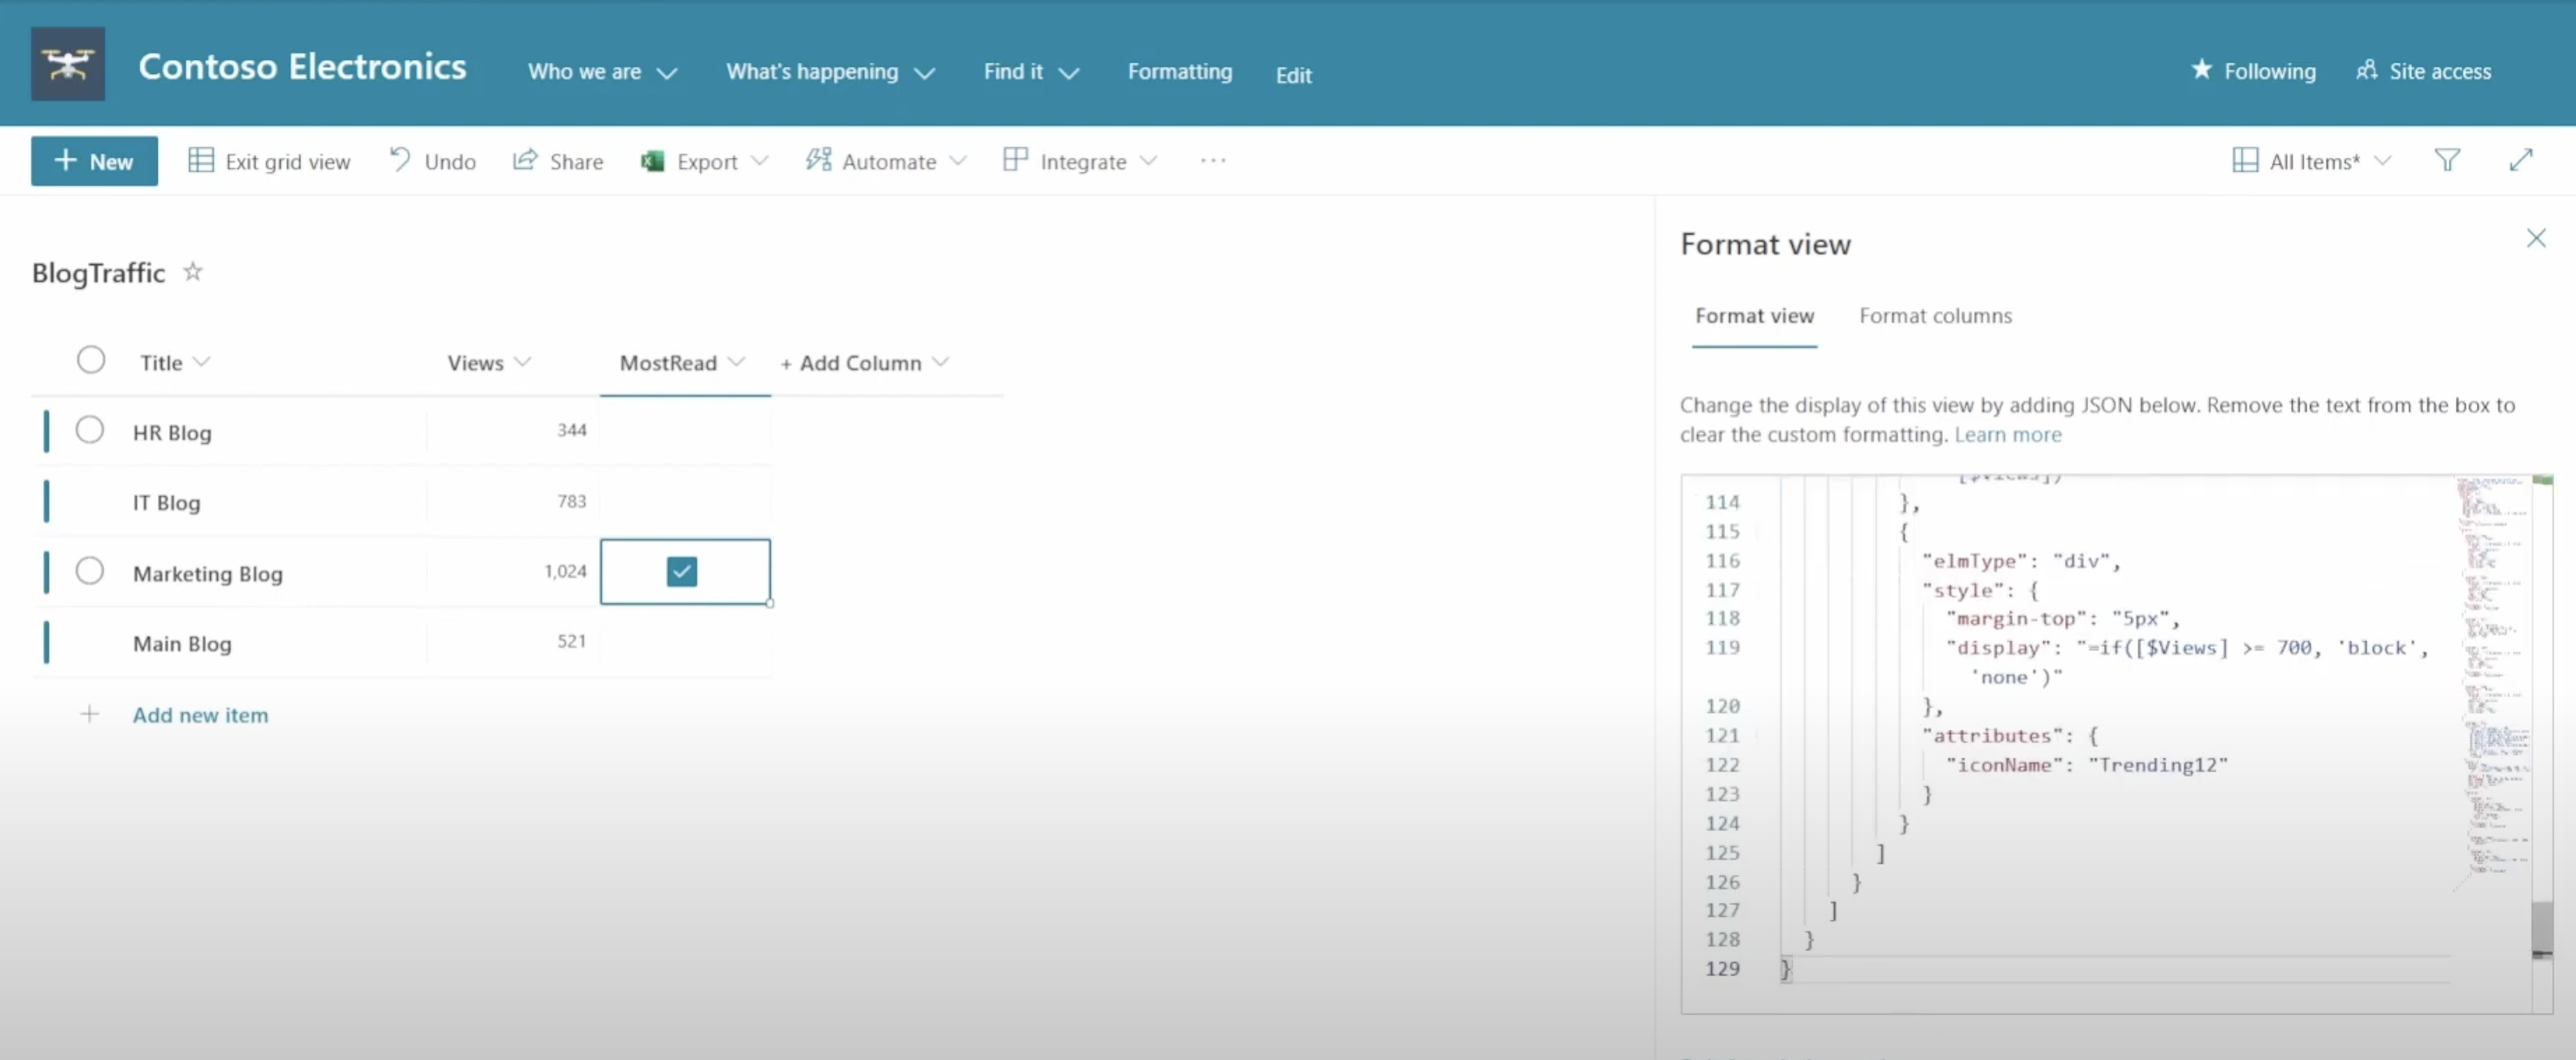
Understanding SharePoint Chart Creation with JSON
Today's discussion involves a tutorial video on SharePoint Online, guiding viewers through the process of creating bar charts using JSON formatting. The video aims to simplify data visualization in SharePoint Online and enhance reporting capabilities through dynamic visuals. With JSON, non-developer users can also engage in data representation, making the process widely accessible and beneficial for various workplace functions.
The emphasis is given on the ease of learning provided through this visual aid, ensuring that viewers can quickly produce professional-looking bar charts. The video proves that data visualization is straightforward and can be mastered swiftly with the right guidance. This transformative approach encourages a more engaged and visually appealing presentation style within organizations.
JSON formatting's role is not just limited to developers but extends to everyone willing to learn. It provides a valuable skill that enables employees to craft enhanced reports and presentations, ultimately contributing to their professional growth. By adhering to these provided steps, even those new to SharePoint Online can begin implementing dynamic list formatting with confidence.
The content moves forward by focusing on cultivating a positive organizational culture. By utilizing JSON list formatting, companies can revolutionize the way they recognize and celebrate employee achievements. This modern appreciation system, paired with technology, adds significance to each acknowledgment made within the workplace.
The instructive nature of the video makes system implementation user-friendly. It is designed to assist viewers across varying levels of SharePoint experience. Whether you are a seasoned SharePoint Online admin or are new to the platform, the video guides you through creating personalized and dynamic recognition templates. This approach helps in enhancing the way accomplishments are celebrated in the company.
The conclusion of the video seeks viewer engagement, asking them to like, subscribe, and activate notifications for future content. It highlights the importance of staying informed about the innovative ways of using JSON list formatting in SharePoint Online for employee recognition. The message is clear: embracing this technological advance will add a remarkable touch to every commendation shared within an organization.
Further Insights into SharePoint Online and Data Visualization
SharePoint Online is a potent platform for enterprise collaboration, offering a myriad of features for document management, communication, and teamwork. Among its capabilities, data visualization stands out as a crucial, yet often underutilized, tool. Through the use of JSON formatting, SharePoint Online allows the creation of intuitive and interactive charts that can serve multiple purposes, from monitoring project timelines to elucidating complex data sets.
Given its cloud-based nature, SharePoint Online provides an agile and flexible environment where real-time data representation can enhance decision-making processes. As businesses continue to navigate increasing data volumes, the ability to distill this information into clear visuals becomes paramount. By leveraging SharePoint for this purpose, companies can foster a culture of transparency and insight-driven strategy.
Moreover, with its user-friendly interface and expansive community of users, SharePoint Online encourages continuous learning and innovation. It's a platform eager for users to explore new horizons with data, and with videos like the one discussed, it becomes significantly easier for users to adopt these advanced functionalities. By empowering employees at all levels of the organization with these tools, SharePoint Online positions itself as a central hub for business intelligence and data management.
Keywords
SharePoint Charts JSON, SharePoint Visualization JSON, JSON Formatting SharePoint, SharePoint Custom Charts, SharePoint JSON Chart Tutorial, Create Charts SharePoint JSON, SharePoint List Charts JSON, SharePoint JSON Graphs, SharePoint Dashboard JSON, SharePoint Online Chart JSON