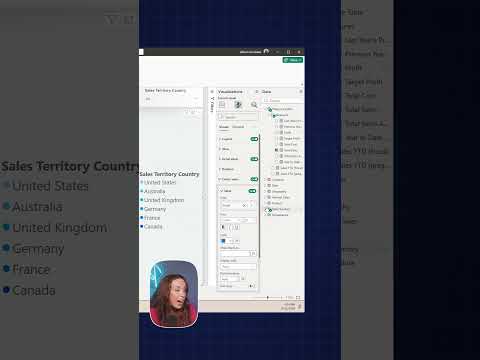
Power BI donut charts: show a custom center measure
Power BI report authors can put a custom measure in a donut chart’s center and have it respond to selected slices.
Key insights
- The center can show a custom measure instead of the donut chart’s total.
- Selecting a country slice updates the center measure for that selection.
- Add a suitable label so readers can distinguish the center value from the slice values.
- The demonstration also shows adding an image or background to the chart center.
Power BI donut charts can show a custom measure in the center instead of the chart’s own total, giving viewers another metric alongside the segment breakdown. This is useful for report authors who want a compact view of a category’s sales and a related measure, such as profit. Pragmatic Works demonstrates the technique with a Sales Amount by Sales Territory Country example.
What it does
The center value does not have to repeat the value represented by the donut’s segments. In the demonstration, the segments show sales by country while the center displays a different measure. That lets a report present two related figures in one visual.
The center also responds to selection. When the demonstrator selects Canada, the center updates to show the corresponding profit measure for that selection. The example illustrates how the metric can follow the viewer’s interaction rather than remain a fixed, unrelated number.
The center can be styled with a label, an image, a background color, or a background image, according to the demonstration. These additions can help clarify what the center number represents.
Who it is for and what you need
This technique is for Power BI report authors building donut charts with a category breakdown and a second metric they want to display in the center. The example uses AdventureWorks data, Sales Amount, Sales Territory Country, and a custom measure for profit.
The transcript does not state a required Power BI license, product version, region, or preview status. It refers to an August 2024 update, but does not identify a release channel or confirm current availability. Check your own Power BI environment for the formatting options before planning a report around them.
How it works
Start with a donut chart that uses a measure for its segment values and a category for its slices. Then use the chart’s center-value capability to display a different custom measure. The transcript does not give the precise pane or menu path, so these steps describe the demonstrated setup rather than a complete interface walkthrough.
- Build the donut with Sales Amount as the value and Sales Territory Country as the category.
- Set the center to show a custom measure, such as profit, rather than the sales total.
- Add an appropriate label so viewers understand the center metric.
- Select a slice to check that the center measure reflects the selection.
Pragmatic Works also demonstrates adding an image or background styling to the center. The linked Power BI topic page covers the product area.
Limitations and open questions
The short demonstration does not provide exact formatting-pane steps, measure definitions, or compatibility details. It also does not explain how to configure labels, images, or backgrounds. The August 2024 reference is not enough to establish whether the capability is available in every current environment.
The example supports using a label to prevent confusion between the center metric and the segment values. It does not compare the method with layered visuals or discuss other alternatives. Verify the interaction and formatting in your own report before relying on them.
Sources
Frequently asked questions
Can a Power BI donut chart show a measure other than its total in the center?
Yes. The demonstration shows a custom measure in the center while the donut segments represent Sales Amount by country.
Does the center measure change when I select a donut slice?
In the demonstrated example, selecting Canada updates the center measure to show profit for that selection.
Where do I set the custom center measure in Power BI?
The demonstration does not give the exact menu path or formatting-pane steps. It shows the result and advises adding an appropriate label.
What Power BI license or version is needed for a custom donut center value?
The available material does not specify licensing, version requirements, or availability across environments.