- All of Microsoft
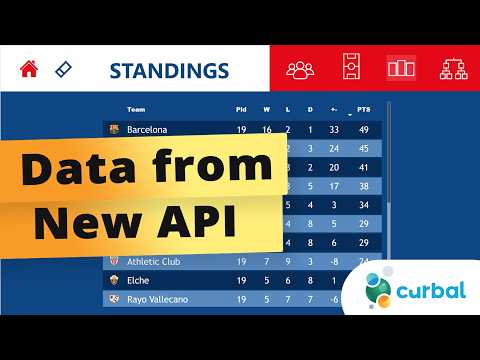
Football Project: Explore New API Data
Power BI guide to pull competition match team standings from a new API and build dashboards with Excel and DAX
Key insights
- New API overview: The video explains how to extract football data from the new API for competitions, matches, teams, standings.
It shows step-by-step examples so you can pull structured game and season data for analysis. - Tech stack: The workflow combines cloud AI and data services like Azure AI Foundry, Azure OpenAI, and Azure Cosmos DB, plus sideline hardware such as Surface Copilot+.
It highlights real-world platforms (for example, the Viper system) that aggregate video, scouting, and tracking data. - Key benefits: Teams gain much faster insight from raw footage and stats, cutting video review time and making large archives quickly searchable.
Example results include big reductions in manual review time and instant queries across thousands of hours of footage. - Practical uses: Coaches and staff use the API for game prep, scouts use it for prospect analysis, and analysts use it to track personnel, snap counts, and formations.
The tools also support injury review and real-time scouting at events like combines. - Security and access: Data access relies on identity and conditional controls such as Entra ID to protect sensitive player and strategy information.
Teams keep control of who sees game plans and private footage. - How to integrate: The video demos filtering plays by down, distance, scoring plays, or penalties and shows using play filtering with natural-language helpers like Copilot.
It also shows exporting or connecting results to Power BI (PBIX) files for dashboards and reporting.
Overview of the Curbal video
The YouTube video by Curbal, titled FOOTBALL PROJECT #9: Data from new API, walks viewers through extracting football data for competitions, matches, teams, and standings. In a clear, hands-on style, the presenter shows how to connect those endpoints into analytics files and demonstrates the resulting reports. Importantly, the video also points viewers to downloadable pbix files and additional learning resources for those who want to follow along. Overall, the episode sets a practical tone by combining live demonstrations with ready-to-use materials.
What the video demonstrates
First, the presenter outlines how to authenticate and call the API to pull structured data about competitions, fixtures, and team rosters, and then maps those responses into a usable model for reporting. Next, viewers see step-by-step how data arrives in Power BI, including transformations to normalize nested JSON and to create relationships for match-level analytics. Then the video highlights visual techniques to display standings and match outcomes, showing how to make those visuals both informative and responsive to filters. Finally, the host emphasizes reproducibility by sharing the original report files for download and encouraging experimentation.
Moreover, the video situates the technical walkthrough within a broader workflow: it explains why pulling data directly from an API can speed analysis compared with manual CSV exports. The presenter demonstrates query examples that reduce repetitive tasks, and shows how parameterization can support multiple competitions or seasons. As a result, analysts can scale the same report logic across leagues without rebuilding transformations each time. At the same time, the video stresses good housekeeping, such as naming conventions and incremental refresh, to keep reports maintainable.
Technical stack and practical workflow
The demonstration uses Power BI as the primary visualization and modeling tool, while the API provides the raw, structured inputs including teams, matches, and standings. The video explains applying Power Query steps to flatten complex records and to convert nested arrays into normalized tables, then creating relationships for performant visual queries. In addition, the presenter shows how to use parameters to switch between endpoints or seasons, which helps maintain a single report template for different datasets.
Transitioning from raw data to an analyst-ready model, the host also covers refresh strategies and the importance of data types and keys to prevent broken visuals. He points out how scheduled refreshes and incremental loads reduce waiting time and server load, and how proper indexing and query folding can speed up data pulls. Therefore, the workflow balances ease of development with the operational need for efficient refreshes in production.
Tradeoffs and challenges
While the approach offers clear speed and flexibility benefits, the video candidly addresses tradeoffs, particularly around API limits and data completeness. For example, real-time or high-frequency pulls can hit rate limits, and some endpoints may not return every field needed for advanced analytics, which forces workarounds. Consequently, analysts must decide between pushing complexity into the ETL layer or adapting the reporting layer to tolerate gaps in source data.
Moreover, the video explains challenges with nested JSON and schema changes: when the API updates a response structure, transformation steps can break and require maintenance. Therefore, there is a balance between automating ingestion and keeping transformation logic simple and resilient. Finally, the presenter notes considerations around data security and access control, suggesting organizations plan role-based access and secret management to protect sensitive data during reporting and sharing.
Practical takeaways and next steps for analysts
For analysts who want to reproduce the video work, the most actionable advice is to start with a single endpoint, build a clean model, and then parameterize and generalize once the logic is stable. Furthermore, experimenting with the supplied pbix files helps reduce trial-and-error time because the transformations and measures are already in place. In addition, practicing incremental refresh and monitoring API responses will pay dividends as reports scale to more competitions and larger historical datasets.
In conclusion, the Curbal video provides a pragmatic, example-driven guide for integrating football data into business intelligence workflows while honestly addressing the performance, maintenance, and governance tradeoffs. It serves both beginners who need a clear starting point and intermediate users who want to refine production-ready patterns. Consequently, viewers can adopt the methods shown to accelerate sports analytics projects while planning for the operational demands that come with automated data ingestion.
Keywords
football data API, football API tutorial, soccer data API, sports data analytics, football analytics API, API for football stats, football project tutorial, integrating football API