Data Analytics
- All of Microsoft
Zeitspanne
explore our new search
Power BI
24. Juni 2026 12:26
Power BI: Ultimate Custom Tooltips Guide
von HubSite 365 über Pragmatic Works
Microsoft Power BI report page tooltips for cleaner reports with state maps, top airport insights and Power BI Service
Key insights
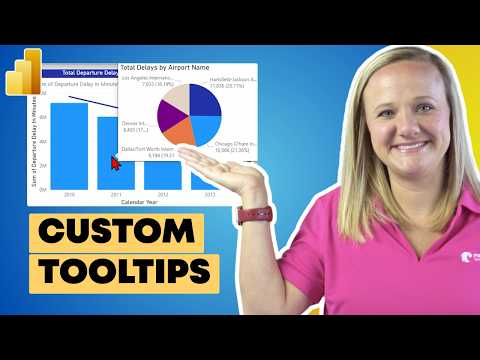
- Custom tooltips — Turn ordinary hover tooltips into small report pages that give clear context without adding more visuals to the main canvas. They let users see deeper details on demand and keep reports uncluttered.
- Tooltip report page — Create a new report page and enable it for use as a tooltip, then add cards, maps, or charts to build the mini-report. Resize the page canvas to fit the layout and improve legibility.
- Tooltip bucket — Put the relevant fields into the page’s Tooltip bucket so the main visual passes filters to the tooltip. Connect tooltips to fields like distance group or calendar year to control what data appears.
- Top N filtering — Apply Top N filters when you need ranked insight, for example showing the top five airports with the most delays. Use a compact chart (such as a pie or bar) to highlight those items clearly.
- Format visuals — Format labels, remove unnecessary legends, and adjust detail labels and sizes so the tooltip reads quickly. Clean formatting helps users absorb the mini-report at a glance.
- Hide tooltip pages — Hide tooltip pages from the main report navigation before publishing so they only surface as hover details and do not clutter the report structure.

Keywords
Power BI custom tooltips, create custom tooltips Power BI, Power BI tooltip page tutorial, Power BI report tooltips guide, dynamic tooltips Power BI, tooltip report page Power BI, custom tooltip visuals Power BI, Power BI tooltip best practices