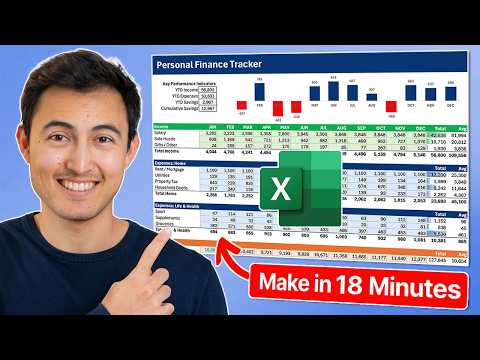
Excel: Personal Finance Tracker Template
Co-Founder at Career Principles | Microsoft MVP
Build an automated personal finance tracker in Microsoft Excel and Power BI with SUMIFS, conditional formatting and KPIs
Key insights
- Transactions Sheet: Log each income or expense once in a table with date, description, amount and category.
Paste bank CSVs or type entries and the table auto-expands to include new rows. - SUMIFS: Use SUMIFS formulas to pull totals by month and category so values update automatically.
This avoids manual copying of formulas or building pivot tables for standard summaries. - Savings Calculation: Calculate savings as Income minus Expenses per period and track year-to-date totals.
Use AVERAGEIFS or simple averages to show monthly and annual trends. - Dashboard: Build a summary sheet with months, category breakdowns, totals and a KPI area for quick insight.
Add charts to visualize cash flow, monthly savings and category spending at a glance. - Conditional Formatting: Apply conditional rules and inverted color charts to highlight overspending, targets and KPI thresholds.
Clean formatting makes the dashboard easier to read and act on. - Automation & Import: Import transactions, assign categories, and let formulas and tables drive the tracker so you don’t copy or paste results.
The workbook updates dashboards and KPIs automatically when you add or refresh data.
In a recent YouTube tutorial, Kenji Farré (Kenji Explains) [MVP] walks viewers through building a fully dynamic personal finance tracker in Excel. He demonstrates how a single transaction log can feed a complete dashboard, removing the need to copy formulas or rebuild pivot tables manually. In addition, Kenji offers a free downloadable workbook so users can follow along and adapt the template to their needs. Overall, the video focuses on practical steps, clear formulas, and visual polish that together turn raw transaction data into timely insights.
What the Video Covers
First, Kenji starts with a clear structure: a Transactions Sheet for raw inputs, a tracker layout for months and categories, formula-driven value cells, and finally formatting and visuals. He explains how converting transaction data into an Excel Table makes the workbook more reliable because it expands automatically as you add rows. Next, Kenji demonstrates how to use the SUMIFS function to pull monthly and category totals into the dashboard without manual copying. Finally, he shows how to calculate savings and annual averages so viewers can measure progress at a glance.
Moreover, the video presents practical tips for formatting, including the use of conditional formatting and inverted color charts to highlight KPIs and trends. Kenji emphasizes keeping the tracker simple to start, and then layering on visuals once the core calculations work correctly. He also walks through cleaning up formatting so the dashboard reads well on different screens. Therefore, the tutorial balances technique and presentation to help everyday users build a usable tool quickly.
How the Tracker Is Built
Kenji’s method begins with a straightforward transaction table that includes date, description, amount, category, and type (income or expense). Then he lays out a tracker sheet with months across columns and categories down the rows, which organizes the workbook for fast review. After that, he fills the tracker with dynamic formulas using SUMIFS so numbers update automatically when new transactions arrive. This approach reduces repetitive work and makes monthly reporting consistent and repeatable.
In addition to monthly totals, Kenji shows how to calculate savings by subtracting expenses from income for each period, and how to use averages to smooth irregular cash flows. He suggests creating clear category names and limiting free-text entries to reduce the need for manual recategorization later. Meanwhile, the transactions table acts as the single source of truth, which helps avoid errors from multiple copies of data. Consequently, this structure supports both quick reviews and deeper analysis when needed.
Visuals, KPIs, and Automation
Once the numbers are working, Kenji turns to KPIs and charts so users can see year-to-date savings, month-by-month comparisons, and category breakdowns visually. He explains how simple visuals and bold color choices make trends easy to spot, and how inverted color charts can emphasize goals or risks. He also applies conditional formatting to call out overspending or unusual transactions, which helps users catch issues quickly. Therefore, visuals are not just decorative but functional for ongoing money management.
Kenji mentions automation options, such as importing bank CSVs into the transactions table, which speeds data entry but requires care to keep categories consistent. He points out that setting up automated rules or consistent import templates reduces manual cleanup. However, he also notes that full automation depends on the quality of bank exports and the complexity of a user’s finances. Thus, automation can save time but may require occasional oversight to ensure accuracy.
Tradeoffs and Practical Challenges
While the template offers flexibility, Kenji acknowledges tradeoffs between simplicity and power: a very robust tracker can become slow or hard to maintain, while a simple tracker may miss nuance in irregular income or complex investments. Users must balance the desire for detailed categorization with the time they will spend maintaining that detail. In addition, complex formula logic can make troubleshooting harder for people who did not build the workbook themselves. Therefore, deciding how much complexity to add depends on the user’s skills and priorities.
Another challenge is handling varied bank CSV formats and multiple currencies, which often need pre-processing before import. Kenji recommends consistent naming conventions and a small set of trusted categories to reduce mismatches. He also warns that sharing files via cloud services eases collaboration but raises privacy considerations that each user should manage. Overall, good habits in data hygiene and simple safeguards minimize most practical problems.
Who Benefits and Final Takeaway
The video targets people who want control over their finances without paying for subscription software, including students, families, and small business owners who prefer spreadsheets. Kenji’s step-by-step approach suits users who already know basic Excel functions and want a template they can adapt quickly. Moreover, the free workbook he provides helps viewers learn by doing, which accelerates adoption compared with reading instructions alone. Therefore, the tutorial serves both as a teaching tool and a practical starting point for personal finance tracking.
In summary, Kenji Farré’s tutorial delivers a balanced, hands-on guide to building a dynamic personal finance tracker in Excel, with attention to structure, calculations, and visual clarity. While automation and charts enhance usability, they also introduce choices about complexity, maintenance, and privacy that users must weigh. Ultimately, the video offers a realistic path for people who want accurate, customizable tracking without added software costs. For readers interested in a usable starting point, Kenji’s template and clear walkthrough make it easy to begin and iterate from there.

Keywords
personal finance tracker excel, free excel budget template, excel expense tracker template, personal finance spreadsheet template, monthly budget tracker excel, money management excel template, budget planning template excel, track expenses in excel