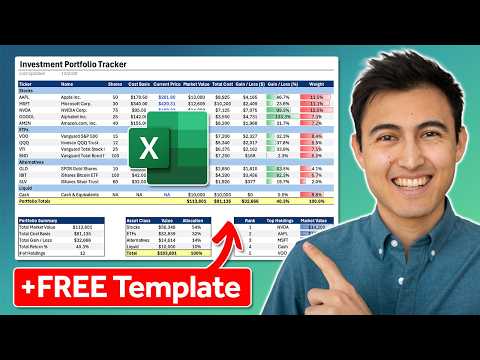
Excel Portfolio Tracker: Stocks & ETFs
Co-Founder at Career Principles | Microsoft MVP
Microsoft Excel expert portfolio tracker for stocks ETFs crypto with live price updates and Power BI insights
Key insights
- Excel portfolio tracker: Build a single workbook to track stocks, ETFs, crypto and cash with live prices and totals.
Use built-in features to keep data current and view overall portfolio value at a glance. - Stocks data type: Convert ticker cells to the Stocks data type to pull price, change and basic company data automatically.
This lets Excel update prices without manual entry during market hours. - Supported assets: Track stocks, ETFs, mutual funds and cryptocurrencies by using proper ticker symbols (for example, AAPL, VTI, BTC-USD).
Excel returns current price and market info for each symbol type. - Key calculations: Use formulas to compute Current Value = Shares × Price, Unrealized Gain/Loss = Current Value − Cost, and ROI (%) = Gain ÷ Cost.
Format results as currency and percentage for clear reading. - Charts & formatting: Add pie charts for asset allocation and bar charts for top holdings, and apply conditional formatting to highlight gains (green) and losses (red).
Turn your table into an Excel Table so charts and ranges update automatically. - Benefits: Excel gives real-time automation, strong customization with formulas and pivot tools, and high cost-efficiency—no paid app required.
It scales from a simple watchlist to a polished dashboard you can refresh anytime.
Overview: A Practical Excel Guide from Kenji Farré
In a recent YouTube video, Kenji Farré (Kenji Explains) [MVP] walks viewers through creating an investment portfolio tracker in Excel that covers stocks, ETFs, cryptocurrencies and cash. The presentation aims to show how built-in features can automate price updates, calculate gains and losses, and visualize allocations without relying on third-party apps. As a result, the video appeals to both casual investors and spreadsheet users who want a low-cost, flexible dashboard for monitoring holdings.
Kenji balances step-by-step instruction with practical examples, and he supplies a downloadable template so viewers can follow along. Consequently, the piece provides a useful starting point for those who prefer hands-on learning and for editors looking to summarize the technique for a broader audience. The tutorial emphasizes clarity and reproducibility while warning about some technical limitations that users should consider.
How the Tracker Works: Data Types and Formulas
The tracker centers on the Stocks data type available in Microsoft 365 versions of Excel, which connects ticker symbols to online financial feeds such as Refinitiv. Once a ticker is entered and converted to the Stocks data type, Excel can return attributes like current price, change percentage, and market value. Kenji then shows simple formulas to calculate current value (shares × current price), investment cost (shares × purchase price), unrealized gain/loss, and return on investment percentage.
In addition, the video demonstrates how to organize holdings into categories—stocks, ETFs, alternatives (for example, Bitcoin and gold), and cash—so the sheet can summarize allocation by asset class. Kenji highlights features such as converting a range into an Excel Table so charts and calculations expand automatically. He also uses conditional formatting and basic chart types to turn raw numbers into an interactive dashboard.
For users seeking historical data, the guide mentions functions such as STOCKHISTORY and the potential to augment feeds with Power Query for more advanced pulls from external APIs. However, Kenji notes that not every symbol or market is supported identically, so manual checks or alternative sources may be required for some cryptocurrencies and niche assets. Thus, the tracker mixes automated pulls with manual inputs where necessary.
Demonstration Highlights from the Video
Kenji structures the video into clear chapters that walk through portfolio structure, adding investments, metrics, and visuals, which makes it easy to follow along. He demonstrates adding tickers, converting them to the Stocks data type, and populating live prices, and then builds summary rows showing the number of holdings and top five positions. Visuals include a pie chart for allocation by asset class and a bar chart highlighting the top five holdings, both of which update as data changes.
Throughout the walkthrough, Kenji emphasizes hands-on steps and pauses to explain each formula, making the process accessible even for intermediate users. He also shows conditional formatting that flags winners and losers, which helps users scan performance quickly. Overall, the demonstration focuses on reproducibility and clarity rather than advanced modeling.
Tradeoffs and Challenges in Using Excel for Portfolio Tracking
Using Excel provides obvious flexibility and cost benefits, yet it also brings tradeoffs. For example, while automated data types reduce manual entry, they depend on online services that may limit the number of requests, change update frequency, or lack coverage for some cryptos and foreign listings. Therefore, investors must balance convenience against potential data gaps and occasional inaccuracies.
Another challenge is maintaining an accurate tax basis and accounting for dividends, splits, or wash-sale rules; Excel can handle these through additional columns and formulas, but that complexity raises the effort required. In addition, the more automation and historical pulls you add via Power Query or APIs, the greater the potential for performance issues or maintenance when providers change endpoints. Thus, users must weigh the benefits of automation against the ongoing upkeep.
Finally, the design tradeoffs include choosing between a simple, fast dashboard and a feature-rich model with many calculated fields and charts. A lean spreadsheet updates quickly and is easier to audit, while a detailed model delivers deeper analytics but requires more care to avoid broken links or stale data. Kenji’s video recommends practical compromises that serve most individual investors without overcomplicating the workbook.
Practical Tips and Final Takeaways
For readers planning to replicate Kenji’s approach, start with a small universe of holdings and test the Stocks data type on the tickers you rely upon. Regularly use the Data tab’s refresh tools, and keep a manual field for cost basis or adjustments that automated feeds do not provide. Additionally, apply conditional formatting sparingly to enhance readability rather than distract from core metrics.
In conclusion, Kenji Farré’s tutorial offers a pragmatic route to a functioning investment tracker using built-in Excel features and clear formulas. While Excel is not a complete substitute for professional portfolio software in all scenarios, the method shown in the video is a strong, low-cost option for many investors, provided they accept the tradeoffs of coverage, maintenance, and occasional manual work. Editors and investors alike will find the video a useful reference for building a customizable, transparent portfolio dashboard.

Keywords
Excel investment portfolio tracker, Excel stock portfolio tracker, portfolio tracker template Excel, ETF tracker Excel, crypto portfolio tracker Excel, track investments in Excel, automated portfolio tracker Excel, build investment tracker Excel