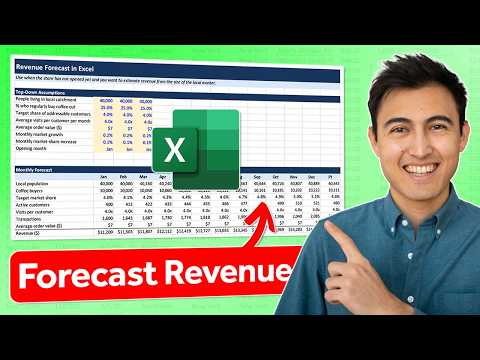
Excel: 5 Revenue Forecasting Methods
Co-Founder at Career Principles | Microsoft MVP
Microsoft expert: Excel revenue forecasting with top-down, bottom-up, growth, run-rate and FORECAST.ETS with Power BI
Key insights
- Five core forecasting methods: The video groups approaches into two for no historical data and three for when you have history.
Use these methods depending on available data and how predictable your revenue patterns are. - Top-Down vs Bottom-Up: Top-Down estimates total market size and your likely share, useful for early-stage planning but sensitive to market-share guesses.
Bottom-Up builds revenue from operational drivers (customers per day, average order value), giving detailed inputs but relying on accurate activity assumptions. - Historical Growth and Run-Rate: Historical Growth applies past year-over-year growth to monthly data and can capture seasonality but won’t explain drivers.
Run-Rate projects forward from recent performance (e.g., last 3 months) and works well for short-term forecasts with optional growth overlays. - Statistical forecasting and Excel tools: Use FORECAST.ETS for seasonal patterns and FORECAST.LINEAR for steady trends; both convert time-series history into numeric projections.
The built-in Forecast Sheet creates visual outputs quickly and shows confidence intervals for ranges rather than single numbers. - Copilot and analysis workflow: Microsoft recommends a workflow—prepare date-based revenue, generate a forecast, then refine with confidence intervals and scenario review.
Use Copilot in Excel to interpret results, test scenarios, and document assumptions for clearer decision-making. - Practical tips and assumptions: Always keep two matching series (dates and revenue) in chronological order and enough history to reveal seasonality.
Document key assumptions and test sensitivity, since method choice and input accuracy drive forecast usefulness.
Kenji Farré (Kenji Explains) [MVP] recently published a YouTube video that summarizes five practical ways to forecast revenue in Excel, and the clip has drawn attention for its clear, step-by-step approach. In straightforward terms, Kenji breaks the topic into methods for situations without historical data and methods that rely on prior performance. He also places each method in context by explaining when it fits typical business needs and what assumptions it requires. As a result, the video serves as a compact guide for analysts, managers, and small business owners who need quick, actionable forecasts.
Overview of the five forecasting methods
Kenji opens by laying out the five main approaches and then shows how to implement them in Excel. First, he contrasts the two techniques for no-historical-data scenarios: the Top-Down and the Bottom-Up methods. Next, he covers three techniques that rely on past figures: Historical Growth, Run-Rate, and a Statistical Forecast using Excel functions like FORECAST.ETS. Throughout, he demonstrates each method with simple examples so viewers can reproduce the steps immediately.
Importantly, Kenji emphasizes that no single method fits every situation and that choosing the right approach depends on available information and the forecast’s purpose. He advises viewers to consider how much data they have, how seasonal the business is, and whether the forecast must be explainable to stakeholders. Consequently, the video balances practical Excel tips with conceptual guidance about selecting and justifying a method. This combination helps users move beyond formulas and think about model reliability.
Top-Down versus Bottom-Up: choosing when data is scarce
When historical sales are unavailable, Kenji explains that the Top-Down method begins with a market-size estimate and then applies an assumed market share to produce revenue projections. Although this method can be quick, he cautions it depends heavily on accurate market sizing and realistic share assumptions, which can be difficult to verify for new ventures. Conversely, the Bottom-Up method builds forecasts from operational metrics such as daily customer counts and average order value, and therefore can feel more tangible. However, it is only as reliable as the activity assumptions, and small errors in daily traffic or conversion rates can compound across a year.
Kenji points out that decision-makers must weigh the tradeoffs between external assumptions and internal operations: the Top-Down approach is useful for high-level planning and investor conversations, while the Bottom-Up approach suits teams that can track operational drivers closely. Therefore, combining the two methods can help cross-check assumptions and reveal inconsistencies. In practice, balancing market-level ambition with realistic operational inputs improves credibility and reduces downside risk.
Methods that use historical data: growth, run-rate, and statistics
For businesses with a revenue history, Kenji outlines three common paths. The Historical Growth method applies year-over-year or month-over-month growth rates to past figures and can incorporate seasonality, but it does not explain why growth happened and may simply extend past trends into the future. The Run-Rate method annualizes recent performance—often by averaging the last three months—and remains handy for quick estimates, especially when recent changes reflect a new, stable level of business. Yet Kenji warns that run-rates can mislead when results are temporary or when a quarter has unusual spikes or drops.
Finally, the Statistical Forecast approach uses Excel’s time-series tools, such as FORECAST.ETS, to model patterns and seasonality automatically. While these tools can provide smoother, defensible forecasts, Kenji notes they often act like a black box because they do not show all intermediate calculations, which complicates auditability. As a result, analysts often pair statistical outputs with simple checks, such as a manual growth calculation or a Bottom-Up sanity check, to ensure results make business sense. Thus, Kenji recommends using statistical forecasts as part of a broader validation process.
Excel tools, Microsoft guidance, and AI assistance
The video also touches on Microsoft’s built-in features that Kenji recommends for different needs, including Forecast Sheet, FORECAST.LINEAR, and FORECAST.ETS. He demonstrates how Forecast Sheet can quickly create visual forecasts and how formula-based functions can support more customized models, while noting that each option has pros and cons in clarity and control. Moreover, Kenji mentions modern aids like Copilot in Excel, which can help interpret outcomes and test scenarios, but he highlights that AI suggestions should be verified against underlying assumptions. Therefore, he urges users to combine automation with human oversight to preserve explainability and governance.
Kenji’s practical tips include checking data order, ensuring date-revenue pairs match, and testing multiple methods to compare results. He also stresses documenting assumptions and presenting confidence intervals when possible so stakeholders understand forecast uncertainty. Taken together, these steps help teams avoid overconfidence in a single number and make better-informed decisions. In the end, the video encourages a disciplined workflow rather than blind reliance on any one Excel tool.
In summary, Kenji Farré’s video offers a concise, usable framework for revenue forecasting in Excel that suits both beginners and experienced modelers. By explaining five distinct methods and highlighting when each works best, he gives viewers a toolkit for balancing speed, transparency, and accuracy. However, his core message is that forecasting also requires judgment: assumptions must be tested and forecasts should be validated in multiple ways. Ultimately, combining methods, documenting choices, and using Excel tools carefully produces forecasts that stakeholders can trust.

Keywords
forecast revenue in Excel, revenue forecasting methods Excel, Excel sales forecast tutorial, revenue projection Excel formulas, time series forecasting Excel revenue, Excel forecasting tools for revenue, forecast revenue using Excel functions, five methods to forecast revenue in Excel