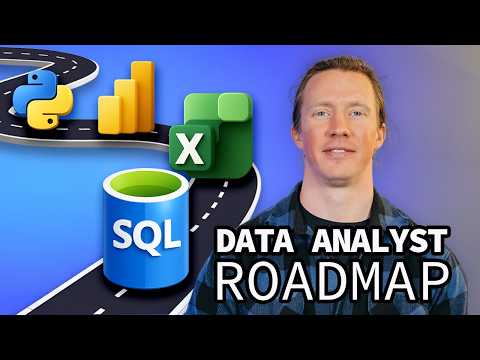
Power BI Roadmap for Data Analysts
What's up, Data Nerds! I'm Luke, a data analyst, and I make videos about tech and skills for data science.
Microsoft expert offers a FREE Data Analyst roadmap with Power BI Excel SQL Python and ChatGPT to boost analytics
Key insights
- This video summarizes Microsoft’s updated Power BI data analyst roadmap and centers the analyst workflow on getting data, cleaning and transforming, modeling, building reports, and operationalizing work in the Power BI service.
- Microsoft now highlights Microsoft Fabric and Copilot in Power BI as core additions; Fabric links enterprise storage and governance, while Copilot speeds model and report creation and enables natural‑language questions.
- Key technical skills to master are Power Query for shaping data, DAX for calculations, and the star schema pattern for reliable models; also practice connecting to Excel, CSV and SQL sources.
- Operational and enterprise topics are essential: learn Power BI Service features such as workspaces, scheduled refresh, gateways, deployment pipelines, lineage, and sensitivity labels to support secure publishing and governance.
- Follow a staged learning path—foundations, data modeling and DAX, advanced reporting, then service and deployment—and use hands‑on practice to prepare for the PL-300 certification exam.
- Build practical portfolio projects like a Sales Summary report, a multi‑source model, and dashboards that show clean shaping, clear metrics, and business storytelling; these prove job readiness and help you apply Copilot effectively.
Summary of Luke Barousse’s YouTube briefing
In a recent YouTube video, Luke Barousse outlines a practical pathway to become a data analyst using Power BI. He frames the learning journey around the sequence of getting data, cleaning it, modeling it, building reports, and deploying them in the service, and he explains why each step matters. Furthermore, he highlights how Microsoft’s evolving tooling now emphasizes broader platforms and AI features that change how analysts work. Consequently, his advice blends classic Power BI techniques with newer concerns like governance and automation.
Barousse presents the roadmap as both a study plan and a set of portfolio goals that learners can follow. He stresses that hands-on projects reinforce concepts more than passive learning, and he suggests building reports that combine multiple data sources and clear storytelling. At the same time, he acknowledges that Microsoft certification remains a useful benchmark for many hiring managers. Therefore, his recommended path balances practical projects with certification study.
What’s new in the 2026 roadmap
Most notably, Barousse points out that Microsoft now integrates Microsoft Fabric and Copilot in Power BI into its data analyst narrative. He argues that these additions reflect a move toward unified data platforms and AI-assisted modeling, which can speed routine tasks and enable natural language queries. Moreover, the video explains that Fabric introduces enterprise-level storage and orchestration that teams should understand for larger deployments. As a result, learners must expand their knowledge beyond report authoring to include platform awareness.
At the same time, Barousse emphasizes that these innovations come with complexity that learners should not ignore. For example, Copilot can accelerate model creation, but it still requires oversight to ensure measures and relationships reflect true business logic. Similarly, Microsoft Fabric offers power and scale, yet it raises questions about cost, governance, and deployment patterns. Therefore, Barousse recommends learning the fundamentals first before relying heavily on these newer capabilities.
Core skills that remain essential
Despite platform changes, the video makes clear that core skills still dominate the analyst role: connecting to data sources, cleaning and transforming data with Power Query, modeling with attention to the star schema, and writing measures in DAX. Barousse explains that these building blocks support reliable analytics and make reports easier to maintain and explain. He further notes that report design and storytelling are vital because visuals need to answer stakeholder questions quickly and clearly. Thus, mastering fundamentals pays off when teams need accurate, repeatable insights.
In addition, Barousse highlights operational topics in the Power BI Service, such as workspaces, scheduled refresh, and deployment practices. He argues that understanding these areas helps analysts move from one-off reports to sustainable solutions that the business can trust. He also suggests practicing with end-to-end projects that include publishing, refresh setups, and access controls. This practical exposure helps learners appreciate the interplay between design, governance, and production reliability.
Trade-offs and practical challenges
Barousse openly discusses trade-offs between speed and rigor when using modern tools like Copilot, noting that productivity gains can come at the cost of hidden mistakes if users do not validate outputs. He points out that relying on automated suggestions may speed early work, but it can also obscure modeling errors and obscure assumptions that later create maintenance burdens. Therefore, learners should balance convenience with careful testing and documentation to avoid building brittle solutions. In short, automation is helpful but not a substitute for analytical judgment.
Another challenge he raises is the tension between breadth and depth in learning. Focusing narrowly on the PL-300 exam can speed certification, yet it may leave gaps in enterprise skills like governance, Fabric concepts, or deployment pipelines. Conversely, trying to master everything at once can slow progress and reduce motivation. Thus, Barousse recommends a staged approach: start with core report and modeling skills, then add service and platform topics as projects demand them.
Practical advice for learners and portfolio building
To conclude, Barousse recommends practical projects such as a multi-source sales report, a metrics dashboard with clear measures, and a model that demonstrates proper data shaping and relationships. He suggests documenting each project, explaining choices, and showing how refresh and sharing were handled to demonstrate real-world thinking. Furthermore, he encourages learners to timebox study, build a small set of polished portfolio items, and use certification study as a complementary validation of skills. This approach helps balance building demonstrable work with preparing for interviews and assessments.
Overall, the video by Luke Barousse offers a balanced roadmap that ties traditional Power BI expertise to modern platform trends and AI capabilities. While new tools promise productivity, he consistently urges learners to ground their practice in solid fundamentals and careful validation. Consequently, aspiring analysts can follow his guidance to build useful skills while navigating the trade-offs that come with scale and automation. Finally, the roadmap he outlines serves both newcomers and those updating their skills for enterprise contexts.
Keywords
Power BI roadmap, Data analyst roadmap, Power BI for data analysts, Power BI tutorial for beginners, Power BI career path, Learn Power BI step by step, Power BI skills checklist, Power BI portfolio projects