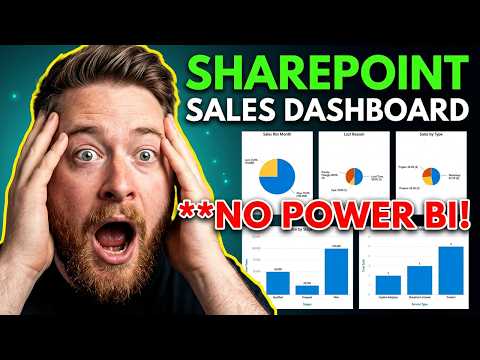
SharePoint Sales Dashboards, No Power BI
SharePoint sales dashboard without Power BI build CRM analytics with lists webparts and Quick Chart in SharePoint Online
Key insights
- SharePoint sales dashboard
Overview of building interactive sales dashboards directly in SharePoint Online without Power BI, using modern pages, lists, and web parts to display sales KPIs and reports. - SharePoint web parts
Use the List, Quick Chart, Document Library, and File and Media web parts to show pipelines, charts, and embedded Excel visuals with no coding required. - SharePoint lists
Structure lists to track deals, activities, and quotas; convert Excel ranges to tables and use PivotTables and slicers when embedding files for dynamic reporting. - No Power BI required
Build dashboards that avoid Power BI licensing by using native SharePoint features, enabling faster setup and lower cost for teams that don’t need full BI tools. - Sales pipeline tracking
Typical pages include a sales pipeline list, activity tracking, and sales totals so managers and reps can view relevant metrics and make decisions quickly. - Quick Chart web part
Use Quick Chart for simple visuals, arrange dashboard cards into columns, preview on mobile, and let site members with edit rights manage and publish dashboards.
SharePoint expert Dougie Wood [MVP] published a practical YouTube tutorial that shows how to build a sales dashboard entirely inside SharePoint, deliberately avoiding Power BI. In the video, he walks viewers through a step-by-step approach that uses SharePoint Online lists, pages, and web parts to create a lightweight CRM and reporting tool. Consequently, the tutorial appeals to teams that want easier setup and lower licensing overhead while staying inside the Microsoft 365 environment. Moreover, Dougie timestamps key sections to help viewers jump to CRM setup, architecture, lists, pipeline tracking, and the final dashboard example.
What the video covers
First, Dougie explains the architecture and shows how to structure lists for sales tracking so that data feeds visuals reliably. Then, he demonstrates how to use the Quick Chart web part plus list and file web parts to display pipeline stages, sales activity, and totals without writing code. He also shows how to update the CRM pipeline and track activities so the dashboard reflects real work rather than static snapshots. As a result, the tutorial delivers a compact, repeatable process that teams can apply immediately to their sites.
How it compares with Power BI
On the one hand, Dougie highlights that building native dashboards in SharePoint removes the need for Power BI licenses and simplifies sharing because pages live inside existing team or communication sites. On the other hand, Power BI still outclasses SharePoint when it comes to advanced analytics, complex relationships, and large-scale data modeling. Therefore, teams must weigh ease of setup and cost against analytical depth and performance needs. In short, SharePoint dashboards work very well for operational views and lightweight reporting, while Power BI remains the better option for enterprise-grade BI and complex calculations.
Practical tradeoffs and challenges
Dougie’s method trades advanced visuals and high-volume processing for speed and simplicity, which introduces a few practical challenges. For example, large lists can slow page load and make charts sluggish, so teams should plan list indexing and threshold management carefully to keep performance acceptable. Also, real-time refresh and cross-list joins are limited in native web parts, so designers must decide whether to accept simpler visuals or to adopt hybrid approaches that use Excel or Power BI for heavier needs. Consequently, governance and data quality become more important because incorrect list structure or inconsistent fields undermine dashboard accuracy.
Tips and best practices highlighted
Dougie recommends structuring lists with clear column names, consistent value choices, and converted Excel tables when needed to preserve filtering and pivot functionality. Additionally, he shows how to use built-in web parts—like the List web part and File and Media integration—to surface filtered records, totals, and Excel-driven charts that update when source files change. He also advises testing the layout on both desktop and mobile to ensure usability for on-the-road sales reps. Finally, Dougie demonstrates simple branding and layout techniques that make dashboards readable without adding complexity.
Who should consider this approach
Small to medium teams and organizations with limited BI budgets will find this method especially attractive because it reduces licensing friction and keeps data inside existing SharePoint sites. Meanwhile, in larger organizations, teams can use SharePoint dashboards for operational roll-ups while reserving Power BI for executive reports and advanced analytics. Also, project leads and SharePoint site owners will appreciate that members with edit permissions can build and manage dashboards without developer support, which speeds delivery but also requires clear governance. Therefore, the approach fits well when the goal is fast, maintainable insight rather than deep analytical modeling.
Overall, Dougie Wood’s tutorial offers a clear, pragmatic path to build sales dashboards within SharePoint that many teams can adopt quickly. However, decision-makers should balance ease-of-use, expected data volumes, and analytical needs before replacing existing BI tools. By following the video’s recommended list structures and web part combinations, teams can create effective, low-cost dashboards that support day-to-day sales work while keeping the option open to scale to more advanced BI later on.

Keywords
sharepoint sales dashboards, sales dashboards without power bi, build sharepoint dashboards, sharepoint reporting for sales, sharepoint dashboard templates, no power bi dashboards, sales analytics in sharepoint, sharepoint list charts for sales